For the first couple of months after the Games, I kept thinking that I needed to get started on my Games recap and hopefully a few new analyses for the offseason. I'd do it tomorrow, I thought, just after work and life slow down. When would that happen? Tomorrow turned into next week, next week turned into next month. Sometime in November, I realized the slowdown wasn't coming any time soon.
I've been adding more and more to this site for the past three years, culminating with the 2nd annual Games Pick 'Em contest this year, which went as well as I could have hoped. We had nearly 75 entries and I was able to keep the standings up to date throughout the up-and-down Games weekend. But since that time, work has picked up and shows no signs of slowing. On top of that, my wife and I are expecting our second child in April 2016. There's just no way I can realistically keep the bar high for content on this site with my current schedule. And if it's going to turn into a half-assed effort, I don't think it's worth it. I'm proud of the level of quality and timeliness that I reached with the site in 2015, and I don't want to sacrifice that.
I don't know if the site is done forever. I hope not, but I also realize it will be hard to get resurrect things after a long time off. My goal is to keep somewhat up to date with aggregating data, which has always been the toughest part of this operation. The web site itself will remain up, so hopefully those of you that are relatively new can still peruse old posts, many of which are still relevant today, in my opinion.
I'd like to thank everyone who has read, commented or contributed to this site over the past three years. Almost all the feedback I received here was positive, or at least constructive. I've only met a handful of you in person, but I feel like I had a small little community of folks that I "knew," albeit only through internet comments, podcast and tweets. So if and when the day comes to get this thing started again, I hope you'll all be here to start reading again.
As always, good luck with your training!
Tuesday, December 1, 2015
Wednesday, September 9, 2015
Back from the Dead with More 2015 Games Analysis
In late July, I caught a break at work that allowed me to watch the 2015 CrossFit Games nearly uninterrupted from Friday through Sunday. I kept up with the CFG Analysis Games Pick 'Em daily and took to Twitter several times a day to converse with others about the action. It was glorious.


The day after the Games ended, things turned around in a hurry. Free time evaporated quickly, replaced by weekends and nights working just trying to keep up at work. In past years, I typically like to post my thorough CrossFit Games recap within a few weeks of the end of the Games, but that just hasn't been possible this year. But I have been able to chip away at a few different analyses, and I figure now is as good a time as any to post what I've found. I know many of you have moved onto the Team Series (starting today!), but this post will focus on the individual 2015 Games season.
Katrin Tanja Davidsdottir and Ben Smith Deserved It
As I do most years, I looked at the results from this year's Games under a number of different scoring systems, and Davidsdottir and Smith wound up on top in all of them. Here are the top 3 under the various systems I tested:
- Classic Points-per-Place (low score wins)
- Men - Smith, Fraser, Gudmundsson
- Women - Davidsdottir, Toomey, Sigmundsdottir
- 2012-2014 Games Scoring
- Men - Smith, Fraser, Gudmundsson
- Women - Davidsdottir, Sigmundsdottir, Briggs
- Normal Distribution Points-per-Place
- Men - Smith, Fraser, Gudmundsson
- Women - Davidsdottir, Briggs, Sigmundsdottir
- Standard Distribution System (not points-per-place)
- Men - Smith, Fraser, Gudmundsson
- Women - Davidsdottir, Briggs, Toomey
Metcons at the Games Keep Getting Heavier
Since the Open began in 2011, the required weights at the Open and Regionals really haven't changed significantly. Think about it: how many times have we seen 75-lb. snatches required for men in the Open? (answer: 4) But at the Games, we've seen a steady trend of heavier and heavier metcons over the years. In 2011, it would have been unreasonable to have 100-lb. dumbbell snatches required in a metcon. Even something like Heavy D.T. (205/145) would have been a major stretch.
The chart below shows the average relative weight load at the Open, Regionals and Games since 2007.

The chart above does consider the 2014 Clean Speed Ladder and the 2015 Snatch Speed Ladder to be metcons, which I think is reasonable considering the weights are required and the athletes are expected to move the weights quickly. If we exclude them, the pattern is generally the same, but it flattens out in 2013-2015. Note that the levels are still well above pre-2013 levels.

2012 Regionals Still the "Heaviest" HQ Individual Competition Ever
Despite these increases in loading for metcons, the 2015 Games was still only the third "heaviest" competition in history, according to load-based emphasis on lifting (LBEL). That's because the points for the 2015 Games were only 49% from lifting events, which is only slightly above the historical average. This year's Games had an LBEL of 0.80, which is above the historical Games average of 0.67 but not an all-time high. The 2014 Games were 55% lifting and therefore had a somewhat higher LBEL (0.89). This is the highest all-time for the Games, but not among all HQ competitions.
The 2012 Regionals remain the gold standard as far as lifting-biased competitions. The points at that competition were 67% from lifting events and the average load in metcons was 1.15, which is on par with the 2011 and 2012 Games and higher than the 2013 and 2015 Regionals. The LBEL at that competition was a staggering 0.92, more than 34% higher than the historical Regional average (0.69). It's still a minor miracle that Spealler was able to pull out a qualification spot.
Want to Win the Games? Better Be Able to Run.
Despite having minimal emphasis at the Open and Regional level, we see yet again that running is a huge component at the CrossFit Games. Running made up 16% of the total points this year, marking the third straight year with at least 11% of the points. In every year since 2012, running has been one of the top 3 most valuable movements at the Games.
In contrast to what we saw at Regionals, where Olympic-Style Barbell Lifts and High Skill Gymnastics made up a ridiculous 81% of the points, they made up less than 40% of the total points at the Games. Aside from running, we saw 30% of the points come from Uncommon CrossFit Movements, including swimming, paddle board, sandbag carry, pig flip, yoke carry, assault bike and peg board climb.
Wednesday, August 5, 2015
Podcast Episode 13: Games Recap with Jesse Mager
Today Anders chats with Jesse Mager, aka JesseM, the second-place finisher in this year's Games Pick 'Em and the champion of last year's Games Pick 'Em. Anders and Jesse chat about how he was able to be so successful in the Pick 'Em, as well as thoughts on the Games in general, whether the pegboard was too hard, if Murph was unsafe and the age at which people should stop doing muscle-ups and squat snatches (maybe never?).
Thursday, July 30, 2015
Initial Games Thoughts
I needed a couple days to decompress from binge-watching this year's Games, but I've been able to do some preliminary analysis and put a few thoughts together. I'll follow up in the next week or two with some more in-depth coverage of this year's Games and the season as a whole.
- Let me start by saying I thoroughly enjoyed watching this year's Games. This is the first year since 2011 that I haven't made the trip to Carson, and while it would have been fun to be there in person again, I thought the live coverage was great overall. Yes, there were some hiccups for us swapping between ESPN3 and the TV feed, causing us to miss out on some early heats that weren't shown on TV, but overall I had no trouble watching as much as I wanted. The announcing has improved leaps and bounds since 2011, and thankfully they treat it as a real sport rather than an excuse to try to sell people on CrossFit (for the most part). That said, I could have done without the constant hyping of the "Assault" bike that's just a fancy version of the AirDyne that's been around since I was born.
- The final event, particularly for the men, was without a doubt the most thrilling in Games history. I'll hold my comments on the pegboard climb for later, but the sheer fact that both champions were NOT in first place heading into the final event made for some top notch drama. After Pedal to the Metal 1, I had a buddy text me asking to do a post comparing Froning in his prime to present-day Mat Fraser (assuming Fraser would proceed with another event win and hang on), but within minutes, Fraser had fallen into second place. And the women's final was just as exciting (excluding the pegboard, I know), with Davidsdottir going unbroken on the deadlifts and farmer's walks LIKE A BOSS. It was really tremendous.
- On the whole, I thought the programming made for some fun events to watch. I'll get into the safety concerns momentarily, but personally, as someone not doing the events, these were really solid for the viewers. The Soccer Chipper was one of my favorites, and I also thought the Midline Madness (not a great name, in my opinion) was particularly intriguing. And then Pedal to the Metal 2 was also pretty great, although those deadlifts looked awfully sketchy (maybe that's just the way I think after a couple back injuries).
- Ben Smith would have won easily using the classic one-point-per-place scoring system (86.5-to-109.5 assuming the points were cut in half for the two sprint events). Not saying I like that system better (I don't), but it does lend more credibility to Smith's victory. He deserved it. The women's top 3 also would not have changed.
- OK, now for the pegboard. Everyone has a different opinion here, but my opinion is that at least one element of this should have been changed. You just cannot have one of the two final events, on national TV, where the majority of the athletes in the final heat (including the eventual champion) cannot complete a single rep. That just can't happen. Either: a) have this event earlier in the competition when people were fresher and it wasn't in prime time; b) allow athletes to drop from the top to make it easier to complete a rep; c) put the pegboard at the END of the workout; or d) announce it ahead of time so athletes could practice. I mean, any of those would have been preferable to what took place on the women's side, right?
- There have been many people who have criticized the programming of this year's Games for being too dangerous for the athletes (here's a great one). I've been around this sport long enough to know that no matter what, there will be criticism of the programming. It does not matter what comes out, there will be pissed-off people. So I'm cautious to overreact here. But we should at least take notice when you have former champions like Annie Thorisdottir dropping out due to exhaustion.
- I wasn't in Carson, and I certainly wasn't competing, so I can't really speak to how the events felt. But, I can say that looking at the programming as an outsider, I think there wasn't anything exceptional about this year. By my estimates, the total time competing was around 163 minutes, which is less than 2012 and 2012 (both above 200) but more than last year (about 130). Things were pretty heavy but not outrageous by Games standards (0.80 LBEL, lower than last year but above the Open-era average of 0.67). This is fourth year of the past five that there has been a long event early on Friday. And the weather, at least compared to where I've always lived, was not terrible (high was 85 Friday according to AccuWeather). I think the big key was simply the Murph event:
- This event was a much higher-rep workout than the long events of the past, meaning more likelihood for things like Rhabdo.
- They held the event in the heat of the day, rather than the morning like in the past. Things are so much more reasonable earlier on, when the Triple-3 was held last year.
- The weight vest added an extra layer of heat, and obviously, athletes aren't allowed to strip that layer off.
- Despite the fact that I'm generally not being too critical of the programming, I wish that at least once in my lifetime, CrossFit HQ will show just a touch of humility and compassion, and perhaps consider admitting when they might be wrong (GASP!). When you see stuff like this Facebook post from Russell Berger, it just makes any level-headed person want to puke. Insulting your own athletes? Really? Do we need to just hand the CrossFit enemies more ammunition?
- The final thing I'll say, and I've said it for years, is that if we want the Games to be a slug-fest with ultra-long events, then we need to send the athletes who are most capable of doing well. I'm not surprised that many Games athletes struggled with Murph, considering they don't need to perform well on that type of event to make it to the Games. Sure, there is a relatively long chipper at the Regionals every year, but nothing like a 45-minute swim/paddle or a 600-rep workout in the heat of the day. Yes, some of these athletes can handle those events quite well, but many cannot. So either don't test those elements at the Games, or test them earlier on in the qualifying process.
Well I've already gotten pretty long here, so that will be it for now. Don't worry, more to come in the coming weeks. Stay tuned.
P.S. I did read the whole interview with Emily Abbott that has been so often quoted (a cached version is here), and honestly it's not nearly as bad as some of the quotes that have been cherry-picked out of it. Take a read and let me know what you think. I am disappointed it was taken down from the site, though.
Thursday, July 23, 2015
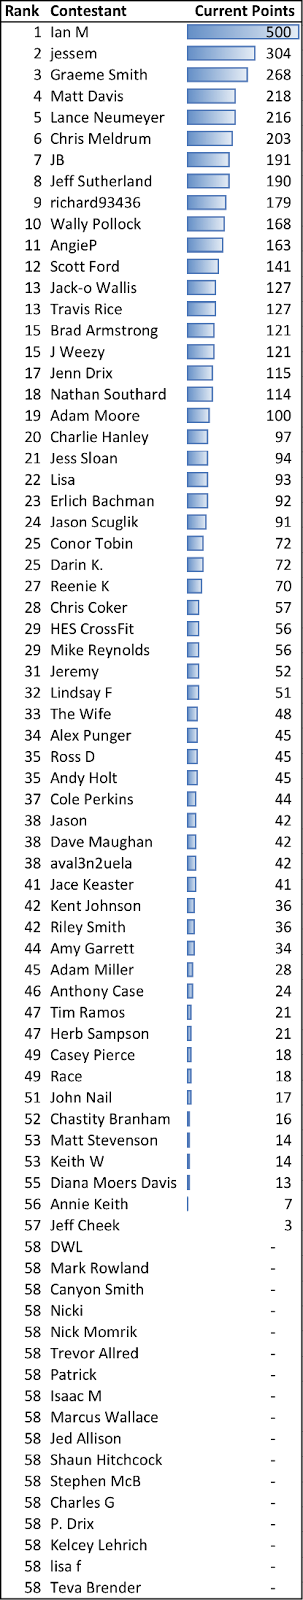
Current Pick 'Em Standings (FINAL)
Standings below are final, pending any potential mistakes I made. PLEASE LET ME KNOW ASAP IF YOU FEEL THERE IS AN ERROR WITH YOUR POINT TOTALS.
This was a wild CrossFit Games, and in the end, the bookie (me) wound up making a huge profit on the gamblers (all of you). The field racked up a mere 5,231 points on 7,400 points of wagers. Not a single one of the 74 entries had Katrin Tanja Davidsdottir winning OR Tia-Clair Toomey on the podium. And I'll be the first to admit, I didn't see this coming either. Better luck next year, and congrats to Ian M!
This was a wild CrossFit Games, and in the end, the bookie (me) wound up making a huge profit on the gamblers (all of you). The field racked up a mere 5,231 points on 7,400 points of wagers. Not a single one of the 74 entries had Katrin Tanja Davidsdottir winning OR Tia-Clair Toomey on the podium. And I'll be the first to admit, I didn't see this coming either. Better luck next year, and congrats to Ian M!
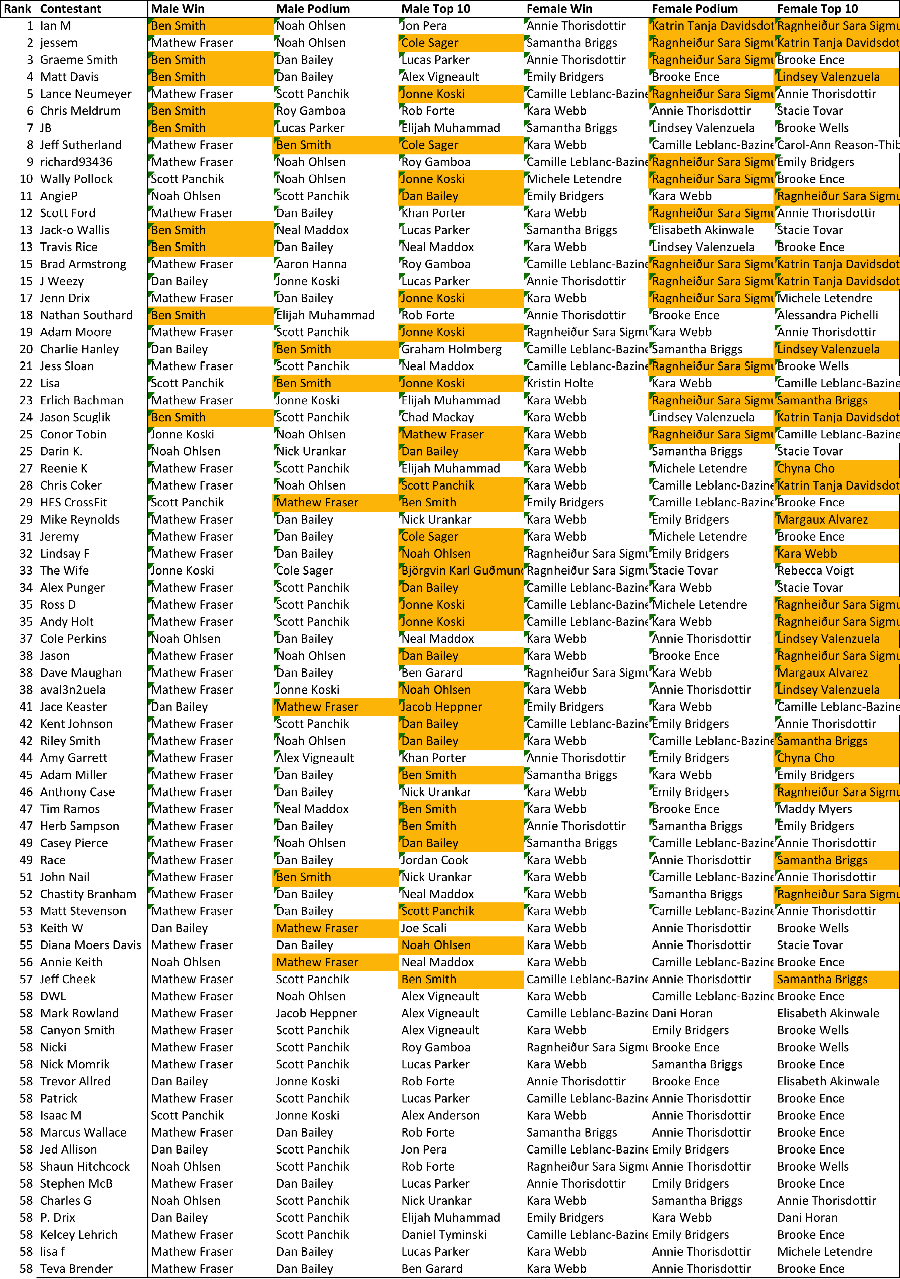
Individual picks are below, with orange highlights for all correct picks.
Monday, July 20, 2015
Podcast Episode 12: Games Preview
Today old friend and long-time CrossFitter Alex Punger joins the podcast to chat about the upcoming CrossFit Games. The two discuss the programming so far, which events they'd like to see repeated from the past, whether or not the softball toss should come back (hint: no) and their picks for the Games Pick 'Em.
Monday, July 13, 2015
Reliving the Best Individual Event Performances in Games History
Today, with just over a week remaining until the 2015 CrossFit Games kick off, I've decided to look back at some of the most impressive individual event performances in recent Games history. How to determine the "best" performances? By using the standard deviation scoring method that I proposed way back when (not that I'm the only one to have proposed it). Using this method, we compare each athlete's score to the average score in that event, then divide by the standard deviation of scores in the event. The larger the number, the further above average the athlete was. This allows us to compare performances across events, and in this case, identify the truly standout efforts.
I'll keep the commentary short here, and instead, point you to videos that you can watch discreetly at work (or in the comfort of your own home, I suppose). For now, I've limited my analysis to 2012-2014. I'll try to expand back into the dark ages at some point. Enjoy:
2013 Legless (women) - Winner: Alessandra Pichelli (4.36 standard deviations above average)
2014 Sprint Sled 1 (men) - Winner: Neal Maddox (3.43 standard deviations above average) - Note: Neal is in the 2nd heat
2014 Cinco 2 (men) - Winner: Rich Froning (3.31 standard deviations above average)
2014 Sprint Carry (men) - Winner: Nate Schrader (3.13 standard deviations above average) - Note: Nate is in the 1st men's heat
2013 Cinco 2 (women) - Winner: Talayna Fortunato (2.89 standard deviations above average)
2012 Rope-Sled (men) - Winner: Matt Chan (2.80 standard deviations above average)
And just for good measure, two of my favorites for the fantastic finishes. Both involve Josh Bridges. I do think the Games will miss him this year.
2014 Push-Pull (probably my vote for the most exciting Games heat of all time)
2011 Killer Kage (note: Bridges actually didn't even win this event, that was Spencer Hendel in a prior heat. But still...)
Wednesday, July 1, 2015
2015 CFG Analysis Games Pick 'Em Now Open
Welcome to the CFG Analysis Games Pick 'Em! This is our second year doing the contest after a pretty good first go-round in 2014.
This year your picks will be submitted through a web form (link at the bottom of this post) rather than through the comments, although please use the comments to let me know of any issues you're having submitting your picks through the form. I'll try to update this page regularly with a list of everyone's picks, so let me know if you spot something that looks off. Currently the form can only enforce certain rules (such as requiring six athletes and wagers on each between 1-50), but it can't do the math for you, so if you have more or less than 100 points wagered, I'll let you know once I go to publish the next day's picks. At that point, it's up to you to submit a corrected entry, since I'll be deleting any invalid picks once the contest starts.
OK, below are the official rules. Even if you entered last year, please read these over. A few items have changed.
- Each contestant has 100 points to wager on six different athletes. You can wager those points in whole-number increments, with a max of 50 and a minimum of 1 on each athlete.
- You must select one wager on an athlete of each gender to win, finish top 3 (podium) and finish top 10.
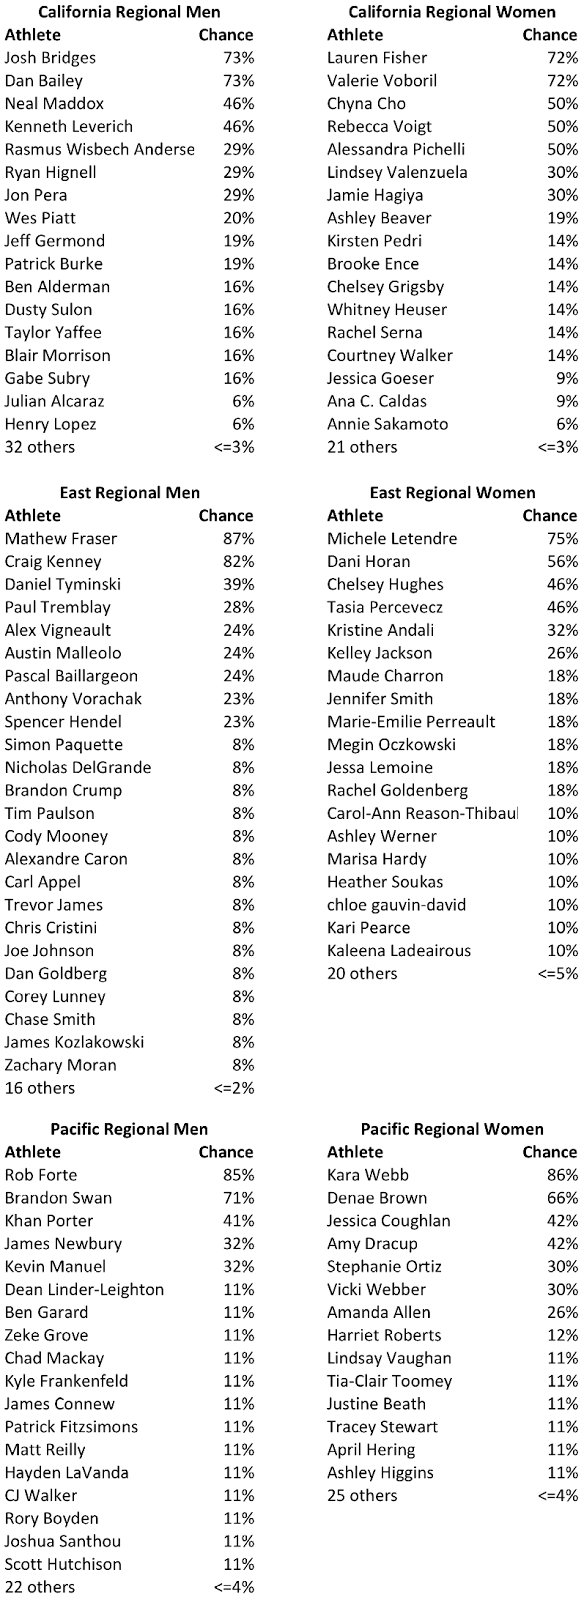
- The payout on each correct pick is based on my predictions (see below) of each athlete's chances of winning, finishing top 3 and finishing top 10. If you wager 20 points on an athlete to win, and I give that athlete a 10% chance to win, you get 200 points if they win.
- On the form, each athlete's name is followed by three numbers. These are the respective payouts for a win, top 3 and top 10.
- At the end of the Games, the winner is the contestant who has the highest total payout on their picks.
- You have until the start of event 1 on July 22 to get your picks in. If you want to revise your picks, please just submit a new entry and post to comments (on this page) that you'd like me to delete your first entry. As noted above, entries with invalid point totals or with the same athlete in multiple spots will eventually be deleted, but I will notify you first.
- You may want to write down your picks as your are filling them out. The form won't automatically send you a confirmation, but you will be able to see your picks once I update the public list of entries, which will usually be daily-ish. I may end up posting them to a shared Google drive if the list gets lengthy (let's hope!).
This is all free, and there is no formal prize, but if you'd like, I'm extending an invitation to chat with me on the podcast for the winner. If interested, please submit your email address. That's optional, and don't worry, if you submit your email address, I'm not going to contact you for anything unrelated to this contest, and I won't publish it.
For a little bit more background on how I make these predictions, read up here and listen to the podcast below. The basic idea is that these picks are based on the simulations of the Games based on combinations of the events that have happened so far this year, but there's a bit more to it than that. I've made some enhancements this year, so in theory, this year's contest should be a little more challenging than in the past. Enjoy!
Click here to access the contest entry form. You can fill out the form on a mobile device or a computer. Keep in mind this is my first time using this software, so I apologize in advance if things are a little buggy early on. Let me know in the comments here what kind of issues you're having and I'll do my best to get things fixed up. Of course, this is not my full-time job, so it could be several hours before I get to it. Worst-case, just post your picks to the comments and I'll get it added.
Click here to view the picks submitted to date.
CFG Analysis Games Predictions:


Podcast:
Click here to access the contest entry form. You can fill out the form on a mobile device or a computer. Keep in mind this is my first time using this software, so I apologize in advance if things are a little buggy early on. Let me know in the comments here what kind of issues you're having and I'll do my best to get things fixed up. Of course, this is not my full-time job, so it could be several hours before I get to it. Worst-case, just post your picks to the comments and I'll get it added.
Click here to view the picks submitted to date.


Podcast:
Friday, June 26, 2015
2015 CFG Analysis Games Pick 'Em Starting Soon
The CFG Analysis Games Pick 'Em is back again this season, and the contest will open sometime in the next 1-2 weeks. The general concept is the same as last season, so read up here if you aren't familiar. However, I'll be making a few changes this season:
- Each contestant will get 100 points to wager, rather than 20 last season. This gives you a little more flexibility in how to allocate your points.
- Points can still be wagered in whole-number increments, but the maximum that can be wagered on each athlete is 50. This prevents people from loading up all of their points on one athlete, and it makes it less likely that someone will win the contest solely based on one big pick.
- You cannot pick the same athlete more than once. For instance, you cannot pick Mat Fraser to win and also to finish top 3. I want people to diversify their picks as much as possible.
- If I can get it set up, the entry form will be something more formal, and not simply the comments section. This will make things easier for you guys, and me as well, particularly if we get a lot more entries this year.
Keep your eyes peeled for my odds to be released in the next couple of weeks, then get your picks in. You can enter anytime up to the time the first individual event starts. Enjoy!
Thursday, June 11, 2015
2015 Regional Review
After week 2 of this year's Regional season, I noted on this blog how many surprises we had seen to that point. Well, week 3 brought more of the same, with big names like Julie Foucher missing the Games and more under-the-radar first-time Games qualifiers, like Joe Scali and Alex Parker in the West Regional. It's still shaping up to be a stacked field at the Games, particularly on the women's side, but let's take a quick look back at the Regionals before we move fully into Games mode.
First, the let's take a look at a few stats about the programming. As I noted on Twitter a few weeks ago, this year's programming appeared to be heavier than last season, but pretty typical compared to 2011-2013. After factoring in the actual loads on the snatch event, here's what we saw for the load-based emphasis on lifting (LBEL) in 2015, compared to prior years:

The effect is relatively small, but the weight of the qualifiers does follow the same pattern as the LBEL of the programming. In 2014, when the LBEL was at its lowest, the average male qualifier was 192 lbs. In 2012, when LBEL was at its highest, the average male qualifier was 199 lbs.
Additionally, I looked at returning regional athletes to see if there was any correlation between weight and the change in rank from year to year. The hypothesis was that since the programming appeared to be heavier this year, bigger athletes should tend to see more improvement in their ranking than smaller athletes. Again, the effect was not huge, but it was consistent with expectations. For men, there was a -12% correlation between weight and change in rank (negative change in rank = improvement), and for women, there was a -8% correlation.
Another thing we saw with the programming this year was an even bigger emphasis on Olympic lifting, with 48% of the points coming from Olympic-style barbell lifts (36% coming from the snatch and clean alone). There was also a decline in basic gymnastic movements, such as the toes-to-bar and pull-up, while high-skill gymnastic movements, such as the muscle-up and handstand push-up, continued to be a major focus. Basic gymnastics made up only 10% of the points, compared with about 20% in 2013-2014, while high skill gymnastics made up 33% of the points. High skill gymnastics made up 36% of the points last season, but only about 15% from 2011-2013.
Combined, Olympic-style barbell lifts and high skill gymnastics made up 81% of the points at the 2015 Regionals. That is the highest of any HQ competition in history. Below is a list of the competitions with the highest percentage of points coming from these two sets of movements:
1. 2015 Regionals - 81%
2. 2014 Regionals - 67%
3. 2015 Open - 61%
4t. 2010 Games - 50%
4t. 2011 Open - 50%
To me, we had a little bit too much emphasis in these areas. These are the two most technical types of movements, so I'm not sure if these are necessarily the same athletes who will excel at the "unknown and unknowable" events at the Games. At Regionals this year, there were also no powerlifting-style barbell lifts, no kettlebell or dumbbell movements and no wall balls. There were also no burpees, just like the Open. The last individual HQ competition prior to 2015 without burpees was the 2007 Games. That just seems odd.
All this being said, I liked the programming this year more than last season. The programming was balanced as far as loading, and the events were pretty well-designed and competitive. Sure, I'd have liked more than 2 attempts on the snatch, and I think event 2 ("Tommy V") was a little boring for the fans, but generally I thought the programming made sense and was good for the fans. Event 7 was another thriller, although I'm still a little bit more of a fan of last year's event 7 (pull-ups/OHS).
Finally, let's look at the qualifying athletes. Of the 40 men's qualifiers, only 15 were first-time athletes. Two athletes, Spencer Hendel and Nick Urankar, returned after missing the Games for at least two years (Urankar had missed three years). Of the 40 women's qualifiers, only 13 were first-time qualifiers. Thuridur Erla Helgadottir also returned to the Games after missing the last two years.
How did my predictions turn out? Actually not bad. I'd like to have a few back, like Stacie Tovar and Lindy Barber each at 4% (probably should have cut them a little more slack for just having a bad year in 2014), but overall, things were pretty well-calibrated. The mean-square error (MSE) was 7.35% this year, which is worse than last year's 4.0%, but things were also tougher to predict this year. Because of the smaller field, a higher portion of the field had a legitimate shot to qualify, which is generally going to make the MSE higher. Had we just given every athlete an equal shot to qualify, the MSE would have been 10.7%, whereas last year it would have been 6.1%.
The chart below shows the calibration of the model this year. You can see that across the whole field, the actual predictions (blue line) were rarely off from the perfect predictions (red line) by more than 5-10%. For instance, the far right blue dot indicates than I gave the best athletes about a 73% chance of qualifying (x-axis), and in reality, those athletes qualified about 68% of the time (y-axis). Not bad!

Before I go, I want to mention the CFG Analysis Games Pick 'Em, which we'll be doing again this year. Be on the lookout for all the rules to come out in the next 3-4 weeks, along with my predictions, which you will be gambling against. I'm planning to make a few improvements, and I think it should make for another good time. If nothing else, it gives you a few more athletes to root for in Carson. See you in a few weeks!
First, the let's take a look at a few stats about the programming. As I noted on Twitter a few weeks ago, this year's programming appeared to be heavier than last season, but pretty typical compared to 2011-2013. After factoring in the actual loads on the snatch event, here's what we saw for the load-based emphasis on lifting (LBEL) in 2015, compared to prior years:
- 2015 - 0.69 men, 0.46 women (48% lifting)
- 2014 - 0.59 men, 0.37 women (43% lifting)
- 2013 - 0.60 men, 0.38 women (43% lifting)
- 2012 - 0.92 men, 0.60 women (67% lifting)
- 2011 - 0.68 men, 0.44 women (48% lifting)
- Average 2011-2015 - 0.69 men, 0.45 women (48% lifting)
As we can see, 2015 was very average as far as loading for the Regionals. There was really nothing outlandish in terms of required loads, and limiting the snatch to two attempts kept the weights lower in that event. In fact, the men's average lift was 232 lbs., and when we look at the men who were in the top 330 in the Open last season (roughly those who would have qualified in the Super Regional format), the average snatch was 235 lbs. And keep in mind that last season was a hang squat snatch, rather than a full snatch, any-style. The women's load did go up from 145 lbs. to 150 lbs., which is probably a testament to the continued improvement of lifting skill among female CrossFit athletes. The limited number of attempts also increased the variability compared to last season: the standard deviation in 2015 was 51 lbs. for men and 32 lbs. for women, whereas in 2014 it was 33 lbs. for men and 28 lbs. for women (again, limiting to the top 330 from the Open).
Another question is, well, does the programming really have an impact on who qualifies for the Games. The answer, in my opinion, is yes, although the effect is rather small. The chart below shows the average weight of the men's Games qualifiers (ignoring top 2 and bottom 2 values each year), as well as the LBEL of the programming at Regionals each year. Weights for 2015 based on data from Sam Swift, prior years were collected manually from the Games site when I wrote last year's Regional Review.

The effect is relatively small, but the weight of the qualifiers does follow the same pattern as the LBEL of the programming. In 2014, when the LBEL was at its lowest, the average male qualifier was 192 lbs. In 2012, when LBEL was at its highest, the average male qualifier was 199 lbs.
Additionally, I looked at returning regional athletes to see if there was any correlation between weight and the change in rank from year to year. The hypothesis was that since the programming appeared to be heavier this year, bigger athletes should tend to see more improvement in their ranking than smaller athletes. Again, the effect was not huge, but it was consistent with expectations. For men, there was a -12% correlation between weight and change in rank (negative change in rank = improvement), and for women, there was a -8% correlation.
Another thing we saw with the programming this year was an even bigger emphasis on Olympic lifting, with 48% of the points coming from Olympic-style barbell lifts (36% coming from the snatch and clean alone). There was also a decline in basic gymnastic movements, such as the toes-to-bar and pull-up, while high-skill gymnastic movements, such as the muscle-up and handstand push-up, continued to be a major focus. Basic gymnastics made up only 10% of the points, compared with about 20% in 2013-2014, while high skill gymnastics made up 33% of the points. High skill gymnastics made up 36% of the points last season, but only about 15% from 2011-2013.
Combined, Olympic-style barbell lifts and high skill gymnastics made up 81% of the points at the 2015 Regionals. That is the highest of any HQ competition in history. Below is a list of the competitions with the highest percentage of points coming from these two sets of movements:
1. 2015 Regionals - 81%
2. 2014 Regionals - 67%
3. 2015 Open - 61%
4t. 2010 Games - 50%
4t. 2011 Open - 50%
To me, we had a little bit too much emphasis in these areas. These are the two most technical types of movements, so I'm not sure if these are necessarily the same athletes who will excel at the "unknown and unknowable" events at the Games. At Regionals this year, there were also no powerlifting-style barbell lifts, no kettlebell or dumbbell movements and no wall balls. There were also no burpees, just like the Open. The last individual HQ competition prior to 2015 without burpees was the 2007 Games. That just seems odd.
All this being said, I liked the programming this year more than last season. The programming was balanced as far as loading, and the events were pretty well-designed and competitive. Sure, I'd have liked more than 2 attempts on the snatch, and I think event 2 ("Tommy V") was a little boring for the fans, but generally I thought the programming made sense and was good for the fans. Event 7 was another thriller, although I'm still a little bit more of a fan of last year's event 7 (pull-ups/OHS).
Finally, let's look at the qualifying athletes. Of the 40 men's qualifiers, only 15 were first-time athletes. Two athletes, Spencer Hendel and Nick Urankar, returned after missing the Games for at least two years (Urankar had missed three years). Of the 40 women's qualifiers, only 13 were first-time qualifiers. Thuridur Erla Helgadottir also returned to the Games after missing the last two years.
How did my predictions turn out? Actually not bad. I'd like to have a few back, like Stacie Tovar and Lindy Barber each at 4% (probably should have cut them a little more slack for just having a bad year in 2014), but overall, things were pretty well-calibrated. The mean-square error (MSE) was 7.35% this year, which is worse than last year's 4.0%, but things were also tougher to predict this year. Because of the smaller field, a higher portion of the field had a legitimate shot to qualify, which is generally going to make the MSE higher. Had we just given every athlete an equal shot to qualify, the MSE would have been 10.7%, whereas last year it would have been 6.1%.
The chart below shows the calibration of the model this year. You can see that across the whole field, the actual predictions (blue line) were rarely off from the perfect predictions (red line) by more than 5-10%. For instance, the far right blue dot indicates than I gave the best athletes about a 73% chance of qualifying (x-axis), and in reality, those athletes qualified about 68% of the time (y-axis). Not bad!

Before I go, I want to mention the CFG Analysis Games Pick 'Em, which we'll be doing again this year. Be on the lookout for all the rules to come out in the next 3-4 weeks, along with my predictions, which you will be gambling against. I'm planning to make a few improvements, and I think it should make for another good time. If nothing else, it gives you a few more athletes to root for in Carson. See you in a few weeks!
Thursday, May 28, 2015
Regional Predictions Week 3: Central, Meridian and West Regionals
We're back for one final week of Regionals. You can get some of my thoughts on the first two weeks of Regionals on the podcast I posted earlier this week. Every year, we seem to have a few seemingly shoe-in athletes not make the Games, but last week was full of surprises. There have been 18 men and women from last year's top 15 at the Games who have competed at Regionals in the first two weeks, and six (33%) have failed to qualify. Those types of athletes generally get a 70-85% chance of qualifying in my modeling, so this is a bit atypical. Two of those, Josh Bridges and Valerie Voboril, have each qualified at least three times in the past.
On the flip side, we've seen some athletes finally break through this year (e.g. Elijah Muhammad) or get back to the Games (e.g. Spencer Hendel). Hendel is one of the few athletes to qualify for the Games, fail to qualify for multiple Games in a row, then qualify again.
I'm sure we'll have some surprises in store in week 3, so it should be a fun one to watch. Enjoy the weekend everyone!
(Note: West Regional predictions revised 5/30 to remove Ben Stoneberg and Emily Carothers, who are not competing. All other athletes' chances increased as a result.)
Monday, May 25, 2015
Podcast Episode 10: Post-Murph Chat and Regional Update
Anders and old pal John Nail catch up post-Murph on Saturday afternoon. Unfortunately the iPhone caught a case of Rhabdo about 7 minutes in, so the conversation gets cut a little short (but SWEET!). To make up for the lost recording, Anders wraps things up on Monday with some thoughts on the first two weeks of Regional competition.
Check for week 3 of regional predictions Wednesday or Thursday this week. Enjoy!
Check for week 3 of regional predictions Wednesday or Thursday this week. Enjoy!
Thursday, May 21, 2015
Regional Predictions Week 2: California, Pacific and East Regionals
One week is in the books, and things went pretty well from a prediction standpoint and a viewing standpoint. Before we get to predictions for week 2, here are some thoughts on what we've seen so far:
One final note: I'm planning to record a podcast this weekend with John Nail. We'll be doing the podcast after the Memorial Day "Murph" workout at my old gym, and we'll be chatting about regionals, my (still unfinished) road back to being a full-fledged CrossFit athlete again, whether Hamm's is truly the best cheap beer available and other subjects of vital importance.
And finally, predictions are below. Enjoy week 2 of Regionals, everyone!
- From a viewing standpoint, I thought the events improved throughout the weekend. "Randy" wasn't bad, but to me, any workout with just a single movement just isn't quite as fun. "Tommy V" was simply too many rope climbs to really be a great spectator event. The long chipper on Saturday was pretty entertaining once the run ended (Emily Bridgers and Anna Tunnicliffe had a nice battle in the Atlantic). The handstand walk followed by the snatch was OK, but nothing great. But Sunday was good for some high drama. The handstand push-ups on event 6 really caused some serious shifts in the leaderboard and it gave us some good battles, like Camille vs. Natalie Newhart in the South. Event 7, while in my opinion not quite as good of an event as last year's pull-up/OHS workout, provided some great theatrics. The men's final in the Atlantic was the only event that I had to watch live, and I (along with with plenty of others it seemed) was rooting for Elijah Muhammad to finally get his trip to the Games. His comeback on that event was exactly the type of drama the sport needs.
- In the past couple weeks, I complained a bit about the fact that only two attempts were given for the max snatch, but my reasoning was that it left athletes vulnerable to being penalized significantly for a single mistake. But watching the event, I also felt like having only two attempts made for an awkward viewing experience. I think we're trained to expect three attempts on something like this, and it felt odd that the event was over after only two tries. It just moved too quickly, in my opinion. If there were three attempts, I think you'd get more athletes really pushing the envelope on that third try, but generally we got some pretty safe lifts for most athletes.
- Speaking of the snatch, for men, the average load lifted was 236 lbs. in the Atlantic and 226 lbs. in the South, and that includes 2 lifters in each region who had no good lifts (those counted as 0 lbs.). For women, the average were 151 lbs. in the Atlantic and 144 lbs. in the South, including 1 athlete in the Atlantic and 3 athletes in the South who had no good lifts. By comparison, the averages on the hang snatch event last year were 224 lbs. for men and 137 lbs. for women. Remember, those fields included about twice as many athletes, so you'd expect the loads not to be quite as high, not to mention the fact that the lift was required to be from the hang and power snatches were not allowed. I think it's safe to say athletes were not as close to their maxes this year.
- The predictions were generally pretty decent in week 1. The only major surprise qualifier was Whitney Gelin from the Atlantic, who I had pegged with a 1% chance. Otherwise, every other qualifier had at least a 13% chance of qualifying. Of the 9 athletes I predicted with greater than a 50% chance, 7 qualified. After the regionals are over, I'll update the calibration plot that I showed last week.
- For this week's predictions, the only significant manual adjustments I made were to boost Mat Fraser's chances a bit (not quite the same amount as I boosted Camille's last week, but close) and to boost Kara Webb's chances (I treated her as if she was a top 15 Games finisher).
One final note: I'm planning to record a podcast this weekend with John Nail. We'll be doing the podcast after the Memorial Day "Murph" workout at my old gym, and we'll be chatting about regionals, my (still unfinished) road back to being a full-fledged CrossFit athlete again, whether Hamm's is truly the best cheap beer available and other subjects of vital importance.
And finally, predictions are below. Enjoy week 2 of Regionals, everyone!
Thursday, May 14, 2015
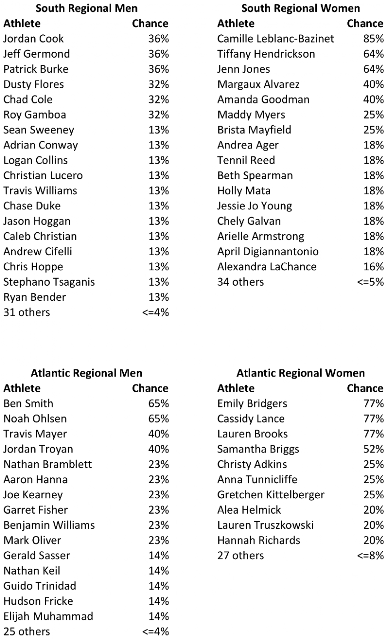
Regional Predictions Week 1: South and Atlantic Regionals
In each of the past four years, fans who've watched the CrossFit Games have seen some really cool stuff. At the Games, you get to see athletes put up some insane weights (377-lb. overhead squats, for instance), you get crazy-brutal events like a 2-hour triathlon or the burden run, and you get to see some events with excellent finishes (like Josh Bridges holding off Rich Froning in "Push Pull" last year). But what you don't typically get is a lot of drama. With the exception of last season's men's competition, the men's and women's titles have basically been decided by the time the last event rolled around, and even in that men's final last year, you never felt like Mat Fraser could really pull it off. You have to go back to the 2010 men's final to really get a big shift at the end, and even that was weird because it was hard to tell that Graham Holmberg was actually going to catch Rich as you were watching.
No, the Games is not where you go for drama. That would be Regionals. If you've been to the event in person on a Sunday, the tension in the air is unavoidable. Watch Sevan Matossian's documentary "Only Three" about last year's Central East Regional and you'll see what I mean. For that reason, the Regionals have long been my favorite part of the season as a spectator.
For the third year, I'll be posting predictions for each athlete's chances of making it to the Games. In the past, these predictions have been fairly well-calibrated, meaning that, for instance, athletes with a 50% chance of qualifying in my model do typically make it to the Games around 50% of the time. That doesn't mean the model is perfect, of course. If it were, I'd give a 100% chance to the 5 athletes who were going to make it. But then again, no model is perfect, and if there were a perfect model, well, there'd be no drama. So keep in mind these are all in good fun.
For more background on the model and how it works, listen to the CFG Analysis Podcast Episode 8 or read up here. In theory, the model should be getting better each year as we get more data from past years to help calibrate it.
Before we get to the predictions, here are some general thoughts on this year's Regionals:
- As far as loading goes, this year is roughly the average of the past four years. The required weights in the metcons are lighter than last year, but there is more lifting overall (48% vs 37%). Although the exact number depends on the numbers we see in the snatch event, the LBEL looks to be around 0.72, which is lower than 2012 (0.92) but higher than 2011 (0.68), 2013 (0.60) and 2014 (0.58).
- Olympic lifting movements play a huge role, even more so than in the past. Every single lift falls into the "Olympic-Style Barbell Lifts" category that I've defined, and even if you restrict that definition to only snatches, cleans and jerks, that's 36% of the points. Thrusters, overhead squats and sumo deadlift high pulls make up another 12%. Historically, this entire group of movements is worth about 33% of the points at Regionals.
- Burpees are nowhere to be found for a second straight competition after appearing in every competition from 2008-2014. Very curious on the reasoning from HQ here...
- I like the move to the Games-style scoring system. This won't punish a single poor performance quite as much (Sam Briggs would have made it to the Games last year under this system), and it rewards elite performances on certain events more so than the past Regional system. More old school thoughts on the scoring system here. If I had my druthers, this is the scoring system I think I'd go with.
OK, well let's get to the predictions. The only manual adjustments I made this week were to bump up Camille's chances a bit (despite her being in the highest-rated cohort already) and to put Sam Briggs into a slightly higher cohort (equivalent to athletes finishing below 15th at the Games last year but top 40 at Regionals last year). Enjoy the weekend everyone!

Wednesday, May 13, 2015
Podcast Episode 9: Regional Preview (with CrossFit Naptown)
Today Anders is joined by Peter Brasovan and Jared Byczko of CrossFit Naptown in Indianapolis. Both competed on Naptown's Games-qualifying team last season and are back on the Regional-qualifying team this year. The guys discuss the 2015 Regionals, including thoughts on whether anyone will fall off the True Form treadmill, dealing with challenging judging standards, the importance of strategy in this year's events and whether anyone who misses the 6:00 time cap on "Randy" will make the Games (hint: NO).
Be on the lookout for Regional Predictions for the South and Atlantic Regionals tomorrow evening (Thursday, May 14)!
Be on the lookout for Regional Predictions for the South and Atlantic Regionals tomorrow evening (Thursday, May 14)!
Wednesday, May 6, 2015
Podcast Episode 8: How Do I Make Regional Predictions?
Today's podcast covers the method behind the madness of predicting each Regional athlete's chances of making the Games. I'll post the week 1 predictions early-mid next week, and we'll have another podcast talking about the events themselves.
Since I never posted it last year, here's the final calibration plot of how last year's predictions ended up. Things shaped up pretty well. The mean-square error was 4.02%, compared with 4.43% in 2013 and 6.07% if you gave every athlete the same chance of qualifying.

Since I never posted it last year, here's the final calibration plot of how last year's predictions ended up. Things shaped up pretty well. The mean-square error was 4.02%, compared with 4.43% in 2013 and 6.07% if you gave every athlete the same chance of qualifying.
Wednesday, April 15, 2015
A Look Back at the 2015 Open: Part II
Welcome back to Part II of the 2015 Open Recap. Sorry for the delay, but we have a lot to get to this year. The introduction of the scaled division has added a whole extra layer of complexity, but I think there's some interesting things to be learned, so let's get to it.
First of all, thanks so much to Sam Swift for pulling the data for 2015 (as well as 2012-2014, which I have used to a lesser extent in this post). He also has some cool analysis on his page, and I suggest you check it out at some point.
For each portion of this analysis, I had to decide whether to include scaled competitors or not. Often, I excluded anyone who scaled any workout, so as to be more comparable to what was done in the past (when scaling was not an option). For instance, with the correlation between workouts, it did not make sense to include scaled competitors at all, as this mixed in scaled and Rx'd workouts and made for an apples-and-oranges comparison. Other times, however, I did include athletes who may have scaled some workouts. For instance, on the 15.2 vs. 14.2 comparison, I included all athletes who did 15.2 Rx'd, regardless of whether they did other workouts scaled. I'll try to note which population was used in each section.
So now for the results. I'll start with the correlation analysis that I've done many times in the past. This basically tells us which workouts were highly correlated with success across the board in that season. The charts below show the correlations for women from 2012-2015 (the mens' results are quite similar).
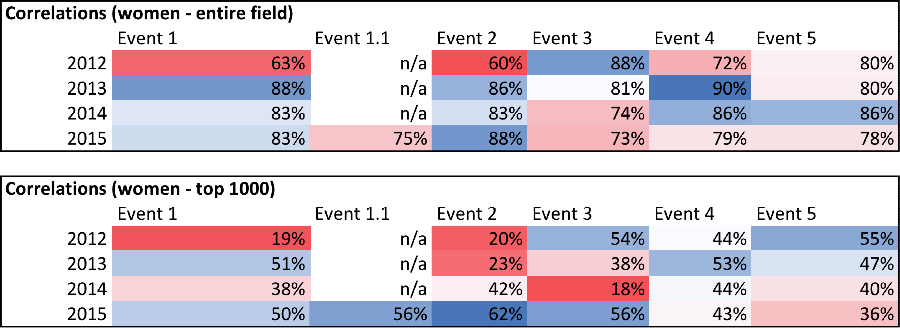
We see first of all that 15.2 was a pretty solid workout. Interestingly, it had a higher correlation this year than 14.2 did last year. You can see the same pattern between 12.4 and 13.3. My guess is this is due to returning athletes having a better feel for this workout, and since returning athletes typically do better in general, we see higher correlations.
What is very intriguing is the fact that 15.1a, the max clean-and-jerk, had a relatively low correlation for the entire field, but a relatively high correlation when we limit to the top 1,000 overall finishers. This would indicate that for the top athletes, the best-of-the-best perform quite well in a max clean-and-jerk. But for the entire field, this event didn't pick out the top athletes as well as the other events.
The scatter plots below, which include an evenly distributed sample of the entire field, illustrate the correlation between event success and overall success for 15.1a, 15.2 and 15.3.


It's clear from the plots above that 15.2 is much more strongly correlated with success across all events than 15.1a or 15.3, but what you can also see is that the outliers in 15.3 and 15.1a are quite different. On 15.1a, note all the dots in the top right - these are athletes who did very well on 15.1a but generally fared poorly on the rest of the workouts. Conversely, on 15.3, note all the dots on the bottom right - these are athletes who did poorly on 15.3 but generally fared well on the rest of the workouts.
One way I've quantified this effect is to look at what I call positive outliers and negative outliers. Positive outliers are the type we saw on 15.1a (in the top left of the graph) and negative outliers are the type we saw on 15.3 (in the bottom left of the graph). In addition to looking at correlations, this metric can help us assess the type of fitness that this is. Does this event expose a weakness (such as muscle-ups in 15.3), or does this event really allow certain athletes to shine (such as the max lift in 15.1a)?
Currently the way I'm defining a positive outlier is an athlete who finished in the top 20% of a particular workout worldwide but finished below the 50th percentile on average across the other workouts. A negative outlier is the reverse of this (bottom 20% on the workout and averaged above 50th percentile on the rest). The chart below shows the number and percentage of outliers on each workout in 2015. As with the correlations, this is limited to athletes who completed all 5 workouts in the Rx division. In this case, I've shown both men's and women's outliers.


For both men and women, 15.1a had by far the most positive outliers. Conversely, 15.3 had the most negative outliers, likely because the muscle-ups proved to be the Achilles' Heel for many an athlete. At some point soon, I'd like to go back and look at this metric for 2012-2015 to see which other events were had a large percentage of negative or positive outliers.
Now let's move on and look at a comparison of the lone repeat workout this year: 15.2. The two charts below show the distribution of Rx scores for women in each year. The first chart includes all athletes who completed all five events in either year, while the second chart is limited to athletes who completed all five events in both years, i.e. returning athletes. The x-axis represents the length of time the athlete survived in the workout rather than the actual score.


Unlike what we saw in repeat workouts in 2014 and 2013, the 15.2 scores were actually better than the 14.2 scores even before limiting to just the returning athletes (you can see this by the red line being skewed to the right, with a higher % of the field surviving late into the workout). But when we limit this to returning athletes, the disparity becomes even greater. Nearly 70% of returning athletes got past the 3-minute mark in 15.2, compared with only about 50% in 14.2 About 35% made it past the 6-minute mark in 15.2, compared with about 20% in 14.2. Clearly, the athletes who return each year are improving.
We've focused mainly on the Rx division so far, but what impact did the scaled division have this year? Before the season, many of us figured that the addition of the scaled division played a role in the workouts that were programmed in the Rx division this year. The charts below would seem to indicate that HQ had no choice but to add a scaled division if they wanted to program workouts like 15.3 and 15.4. The charts both show the total field at each stage of competition, split between scaled (red) and Rx (blue). The numbers represented by those bars are actually taken straight from Sam Swift's site. But the kicker is the line on the graph, which shows what the Rx field would look like if there was no scaled division, i.e. like 2011-2014. That line represents the competitors at each stage that were "fully Rx," meaning they had not scaled at all by that point. Notice the enormous drop-off in 15.3, particularly for the women. Only about 10,000 women would have been left as of 15.5, which is fewer women than were left at the end of competition in 2013.


One thing to note is that the scoring system allowed the scaled competitors to mix in with the Rx competitors, so that some athletes who scaled a workout or two actually finished ahead of some athletes who went Rx the entire time. If that was not allowed, the average fully Rx women's competitor would have improved their percentile ranking by 12% and the average fully Rx men's competitor would have improved their percentile ranking by 3%. I personally don't mind the system in place now, as it incentivizes athletes to use the scaled workouts when appropriate without having to be separate from the main field. But I'd be curious on the thoughts of others.
That wraps it up for today. To be sure, there is more analysis to be done on the 2015 Open data, but it's time to move onto Regionals for now. Stay tuned for a regional preview podcast in the next few weeks, as well as Regional predictions on the site as we close in on the first competitions on May 15.
First of all, thanks so much to Sam Swift for pulling the data for 2015 (as well as 2012-2014, which I have used to a lesser extent in this post). He also has some cool analysis on his page, and I suggest you check it out at some point.
For each portion of this analysis, I had to decide whether to include scaled competitors or not. Often, I excluded anyone who scaled any workout, so as to be more comparable to what was done in the past (when scaling was not an option). For instance, with the correlation between workouts, it did not make sense to include scaled competitors at all, as this mixed in scaled and Rx'd workouts and made for an apples-and-oranges comparison. Other times, however, I did include athletes who may have scaled some workouts. For instance, on the 15.2 vs. 14.2 comparison, I included all athletes who did 15.2 Rx'd, regardless of whether they did other workouts scaled. I'll try to note which population was used in each section.
So now for the results. I'll start with the correlation analysis that I've done many times in the past. This basically tells us which workouts were highly correlated with success across the board in that season. The charts below show the correlations for women from 2012-2015 (the mens' results are quite similar).
We see first of all that 15.2 was a pretty solid workout. Interestingly, it had a higher correlation this year than 14.2 did last year. You can see the same pattern between 12.4 and 13.3. My guess is this is due to returning athletes having a better feel for this workout, and since returning athletes typically do better in general, we see higher correlations.
What is very intriguing is the fact that 15.1a, the max clean-and-jerk, had a relatively low correlation for the entire field, but a relatively high correlation when we limit to the top 1,000 overall finishers. This would indicate that for the top athletes, the best-of-the-best perform quite well in a max clean-and-jerk. But for the entire field, this event didn't pick out the top athletes as well as the other events.
The scatter plots below, which include an evenly distributed sample of the entire field, illustrate the correlation between event success and overall success for 15.1a, 15.2 and 15.3.
It's clear from the plots above that 15.2 is much more strongly correlated with success across all events than 15.1a or 15.3, but what you can also see is that the outliers in 15.3 and 15.1a are quite different. On 15.1a, note all the dots in the top right - these are athletes who did very well on 15.1a but generally fared poorly on the rest of the workouts. Conversely, on 15.3, note all the dots on the bottom right - these are athletes who did poorly on 15.3 but generally fared well on the rest of the workouts.
One way I've quantified this effect is to look at what I call positive outliers and negative outliers. Positive outliers are the type we saw on 15.1a (in the top left of the graph) and negative outliers are the type we saw on 15.3 (in the bottom left of the graph). In addition to looking at correlations, this metric can help us assess the type of fitness that this is. Does this event expose a weakness (such as muscle-ups in 15.3), or does this event really allow certain athletes to shine (such as the max lift in 15.1a)?
Currently the way I'm defining a positive outlier is an athlete who finished in the top 20% of a particular workout worldwide but finished below the 50th percentile on average across the other workouts. A negative outlier is the reverse of this (bottom 20% on the workout and averaged above 50th percentile on the rest). The chart below shows the number and percentage of outliers on each workout in 2015. As with the correlations, this is limited to athletes who completed all 5 workouts in the Rx division. In this case, I've shown both men's and women's outliers.
For both men and women, 15.1a had by far the most positive outliers. Conversely, 15.3 had the most negative outliers, likely because the muscle-ups proved to be the Achilles' Heel for many an athlete. At some point soon, I'd like to go back and look at this metric for 2012-2015 to see which other events were had a large percentage of negative or positive outliers.
Now let's move on and look at a comparison of the lone repeat workout this year: 15.2. The two charts below show the distribution of Rx scores for women in each year. The first chart includes all athletes who completed all five events in either year, while the second chart is limited to athletes who completed all five events in both years, i.e. returning athletes. The x-axis represents the length of time the athlete survived in the workout rather than the actual score.
Unlike what we saw in repeat workouts in 2014 and 2013, the 15.2 scores were actually better than the 14.2 scores even before limiting to just the returning athletes (you can see this by the red line being skewed to the right, with a higher % of the field surviving late into the workout). But when we limit this to returning athletes, the disparity becomes even greater. Nearly 70% of returning athletes got past the 3-minute mark in 15.2, compared with only about 50% in 14.2 About 35% made it past the 6-minute mark in 15.2, compared with about 20% in 14.2. Clearly, the athletes who return each year are improving.
We've focused mainly on the Rx division so far, but what impact did the scaled division have this year? Before the season, many of us figured that the addition of the scaled division played a role in the workouts that were programmed in the Rx division this year. The charts below would seem to indicate that HQ had no choice but to add a scaled division if they wanted to program workouts like 15.3 and 15.4. The charts both show the total field at each stage of competition, split between scaled (red) and Rx (blue). The numbers represented by those bars are actually taken straight from Sam Swift's site. But the kicker is the line on the graph, which shows what the Rx field would look like if there was no scaled division, i.e. like 2011-2014. That line represents the competitors at each stage that were "fully Rx," meaning they had not scaled at all by that point. Notice the enormous drop-off in 15.3, particularly for the women. Only about 10,000 women would have been left as of 15.5, which is fewer women than were left at the end of competition in 2013.
One thing to note is that the scoring system allowed the scaled competitors to mix in with the Rx competitors, so that some athletes who scaled a workout or two actually finished ahead of some athletes who went Rx the entire time. If that was not allowed, the average fully Rx women's competitor would have improved their percentile ranking by 12% and the average fully Rx men's competitor would have improved their percentile ranking by 3%. I personally don't mind the system in place now, as it incentivizes athletes to use the scaled workouts when appropriate without having to be separate from the main field. But I'd be curious on the thoughts of others.
That wraps it up for today. To be sure, there is more analysis to be done on the 2015 Open data, but it's time to move onto Regionals for now. Stay tuned for a regional preview podcast in the next few weeks, as well as Regional predictions on the site as we close in on the first competitions on May 15.
Wednesday, April 8, 2015
A Look Back at the 2015 Open: Part I
We've all had time to recover from the Open, and for a (very) select few of us, it's time to move onto the regionals. But at CFG Analysis, we're not quite finished with the Open quite yet. On the contrary, it's time to take a thorough look back at the 2015 Open, see what the data tells us and start to understand what could be coming in the future.
Like the past two years, I'll be breaking this post up into two parts. Today in Part I, I'll tackle the programming of this year's Open and how it compared to prior years (and what we may have expected). Later this week in part II, I'll dig into the leaderboard a bit more to see what we can find. If you want, see my posts (Part I and Part II) from last year for a feel for what we'll be getting into.
OK, let's get started. Unless noted, all the metrics in this post relate to the Rx division only.
As I got started on the analysis for this post, my gut feeling was that this year's Open was a whole lot different than the past four years. Indeed, looking at the Rx division, many of the metrics that I use to evaluate CrossFit programming were quite a bit different than in the past. But as I looked a little closer, I found that there were really just a few key changes this year. The biggest, in my opinion, was this:
The Open included a max-effort lift.
If you remove 15.1a (1RM clean and jerk), you're left with programming that is actually pretty similar to what we've seen before. The chart below shows the men's loading metrics* for 2011-2015, including a version of 2015 that does not include 15.1a. Note that without 15.1a, things look eerily similar to every other year. With 15.1a, however, this year definitely put a larger emphasis on heavy lifting and (likely) favored larger athletes more than in the past**.

The loading metrics, of course, don't tell the whole story. To me, there were three other key differences from prior years:

Besides the big goose-eggs for burpees and box jumps, note the significance of the clean. Since being a major player in 2011, the clean had not accounted for more than 5% of the points in an Open until this year. The inclusion of 15.1a not only made this year a "heavier" Open, but it contributed to the Olympic-style lifts playing a huge role in the standings. The chart below shows that the Olympic lifts and high-skill gymnastics were valued more than ever in 2015, while basic gymnastics were significantly diminished.

Although this year did include the first max-effort lift in an Open, none of the rest of the events were particularly unusual in terms of load, duration or movements. The chart below shows the time domain (x-axis), number of movements (y-axis) and LBEL (size of ball) for each Open workout 2011-2015***. You'll see that besides 15.1a (which I considered a 0-time domain workout despite technically lasting 6 minutes), the workouts were relatively standard compared to past Opens, though a bit on the shorter side.
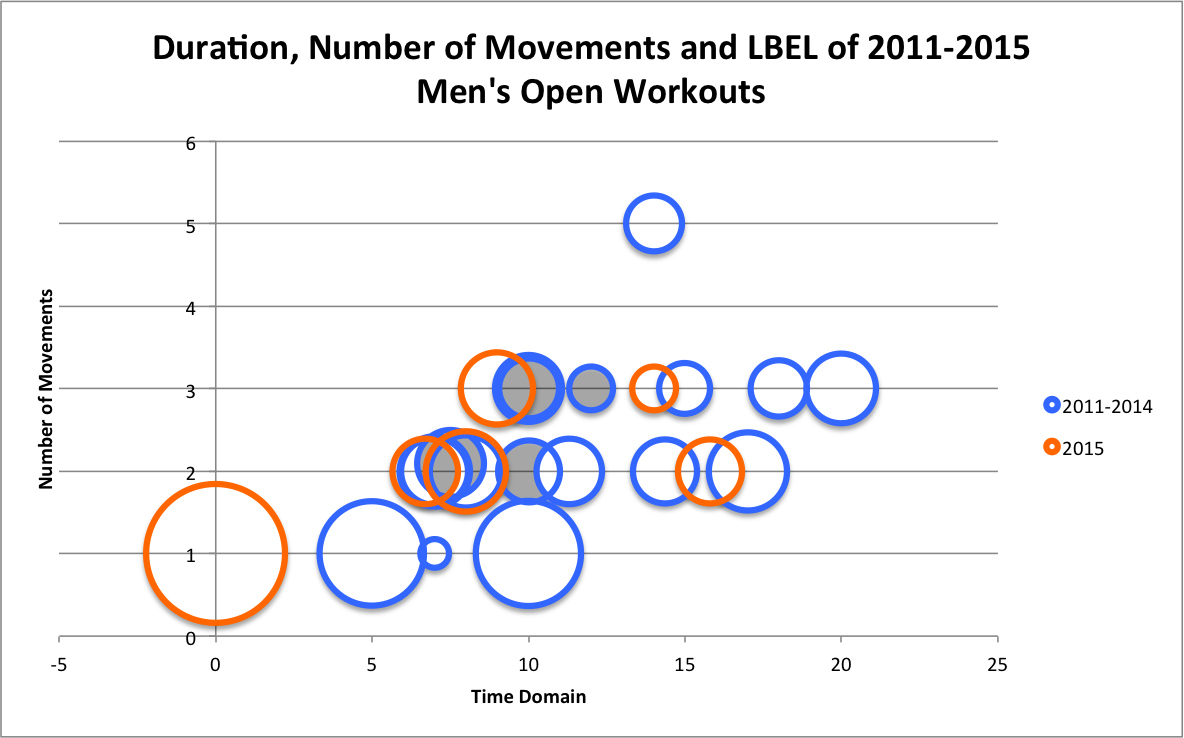
It is worth noting that the 185/125 clean in 15.4 was the heaviest relative weight (1.37/0.93) ever required in an Open. That being said, I feel that the 165/110 squat clean and jerk (1.23/0.82) in 11.3 was more challenging for the community at that time than the 185-lb. clean was this year.
So where is the Open headed? Certainly things could change in the next 10 months if there are other changes to the format (multiple scaled divisions, for instance), but it seems that the Rx division of the Open is starting to look like Regionals-lite. I don't anticipate that the loads will get to Regional levels - the average load in metcons this year was 0.87/0.59, whereas regionals have been averaging 1.12/0.75 in the past. However, the variety of workouts in the Open seems to be mirroring the Regionals. I think we could see one or two of these two-part workouts each year, and I'd bet we'll have a max-effort lift each season.
I think we'll continue to see the scaled division evolve (some of the workouts were a little bland this year, in my opinion), but I think the the loads will stay similar to what we had this year, where they were about 70% of what was required for the Rx division. Now that the community has seen the challenges in the Rx division, I'd expect more athletes to be prepared to scale early and often in the future. There's no shame in scaling, that's for sure.
That will wrap it up for Part I of my 2015 Open recap. Stay tuned for Part II later on this week!
*For more background on these metrics, see this post from back in 2012.
**This is something I plan to look into at some point, possibly in Part II.
***For the time-varying and load-varying workouts (including 15.1a), I took the average of the top 1,000 overall finishers from each particular year. For instance, the top 1,000 overall male finishers took an average of 15.8 minutes on 15.2. I also considered 15.1a and 11.3 to be single-movement workouts, despite including a clean and jerk.
Like the past two years, I'll be breaking this post up into two parts. Today in Part I, I'll tackle the programming of this year's Open and how it compared to prior years (and what we may have expected). Later this week in part II, I'll dig into the leaderboard a bit more to see what we can find. If you want, see my posts (Part I and Part II) from last year for a feel for what we'll be getting into.
OK, let's get started. Unless noted, all the metrics in this post relate to the Rx division only.
As I got started on the analysis for this post, my gut feeling was that this year's Open was a whole lot different than the past four years. Indeed, looking at the Rx division, many of the metrics that I use to evaluate CrossFit programming were quite a bit different than in the past. But as I looked a little closer, I found that there were really just a few key changes this year. The biggest, in my opinion, was this:
The Open included a max-effort lift.
If you remove 15.1a (1RM clean and jerk), you're left with programming that is actually pretty similar to what we've seen before. The chart below shows the men's loading metrics* for 2011-2015, including a version of 2015 that does not include 15.1a. Note that without 15.1a, things look eerily similar to every other year. With 15.1a, however, this year definitely put a larger emphasis on heavy lifting and (likely) favored larger athletes more than in the past**.
- Handstand push-ups appeared for the first time;
- The high-skill gymnastics movements (muscle-ups, handstand push-ups) appeared at the start of a workout, forcing a large portion of the field to scale;
- Burpees and box jumps, which accounted for about 20% of the points in the Open in previous years, did not appear at all.
Certainly #2 bothered a lot of people, but for the athletes competing for spots at regionals, this really had no effect on them. The other two items are somewhat important, and #3 in particular was a shock to me. As I noted on Twitter a few weeks ago, the 2015 Open was the first time since 2007 that the Open, Regionals or Games did not include burpees (excluding 2010 Regionals, when the workouts varied by region). The chart below shows the value of each movement in the Open from 2011-2015 (including 15.1a).
Although this year did include the first max-effort lift in an Open, none of the rest of the events were particularly unusual in terms of load, duration or movements. The chart below shows the time domain (x-axis), number of movements (y-axis) and LBEL (size of ball) for each Open workout 2011-2015***. You'll see that besides 15.1a (which I considered a 0-time domain workout despite technically lasting 6 minutes), the workouts were relatively standard compared to past Opens, though a bit on the shorter side.
It is worth noting that the 185/125 clean in 15.4 was the heaviest relative weight (1.37/0.93) ever required in an Open. That being said, I feel that the 165/110 squat clean and jerk (1.23/0.82) in 11.3 was more challenging for the community at that time than the 185-lb. clean was this year.
So where is the Open headed? Certainly things could change in the next 10 months if there are other changes to the format (multiple scaled divisions, for instance), but it seems that the Rx division of the Open is starting to look like Regionals-lite. I don't anticipate that the loads will get to Regional levels - the average load in metcons this year was 0.87/0.59, whereas regionals have been averaging 1.12/0.75 in the past. However, the variety of workouts in the Open seems to be mirroring the Regionals. I think we could see one or two of these two-part workouts each year, and I'd bet we'll have a max-effort lift each season.
I think we'll continue to see the scaled division evolve (some of the workouts were a little bland this year, in my opinion), but I think the the loads will stay similar to what we had this year, where they were about 70% of what was required for the Rx division. Now that the community has seen the challenges in the Rx division, I'd expect more athletes to be prepared to scale early and often in the future. There's no shame in scaling, that's for sure.
That will wrap it up for Part I of my 2015 Open recap. Stay tuned for Part II later on this week!
*For more background on these metrics, see this post from back in 2012.
**This is something I plan to look into at some point, possibly in Part II.
***For the time-varying and load-varying workouts (including 15.1a), I took the average of the top 1,000 overall finishers from each particular year. For instance, the top 1,000 overall male finishers took an average of 15.8 minutes on 15.2. I also considered 15.1a and 11.3 to be single-movement workouts, despite including a clean and jerk.
Monday, April 6, 2015
Podcast Episode 7: 2015 Open Recap
Enjoy the podcast below as Anders and John wrap up this year's Open. Stay tuned for the full, two-part blog post recapping the Open later this week. As of now, you can expect Part I on Wednesday and Part II on Saturday.
Tuesday, March 24, 2015
Fun With SWAGs: What Will 15.5 Be?
As I mentioned on Twitter last Friday, there will be no podcast this week. I'm out of town, but for good reason: I'm attending the SOA's Fellowship Admissions Course, which means I'll basically be "graduating" after years of taking actuarial exams. I'll be coming home with a few new letters after my name, which is pretty cool.
So no podcast, but that means you get more actual, written words from me - just like in ye olden days, back before I was podcasting and tweeting and listening to all that hippety-hop. Before we get to the SWAG, here's a collection of thoughts about 15.4 and the Open so far:
So no podcast, but that means you get more actual, written words from me - just like in ye olden days, back before I was podcasting and tweeting and listening to all that hippety-hop. Before we get to the SWAG, here's a collection of thoughts about 15.4 and the Open so far:
- If it wasn't already clear, it should be clear now that HQ does not intend the Rx division to be for the masses. They want the everyday CrossFitter to use that scaled division and aspire to make it to the Rx division. I think by next year, people will come into the Open with this mindset, but I'm sure it was difficult for a lot of folks to accept that they'll need to scale workouts this year. But it's just about modifying your perspective, in my opinion. The Open was always too heavy, too hard, too skilled for a lot of CrossFitters. Now they've just made the Rx division an even higher bar to attain, but they've left the scaled division there for the masses. The scaled division is now even more inclusive than the older Opens, so my guess is that in the future, more and more people will scale, and we'll see the Rx division be a smaller subset of the total field than it is now.
- I liked the movement choices for 15.4 (although they went against my SWAG, of course), but Occam's Razor would say "What the hell are you doing with that rep scheme?" Would anyone have complained if it was 3-3-6-6-9-9-...? In that case, the heavy cleans would have played more of a role, and in my opinion, that would have been a well-balanced workout. The way it was written, it was not only confusing, but also seemed quite biased toward the handstand push-ups. I just don't get this one.
- Rich Froning is going to have a hell of a hard time sitting out of the individual competition this year. The man can't even let Matt Fraser just have the Open title. Just watch: Rich will win the final workout, and he will do triple Grace at 315 afterwards and post it on Instagram, just to let you know that he still could win the Games if he wanted to. And Matt Fraser will come in 2nd on the final workout, and he will win the Open, and it will still be damn impressive.
- How did Annie Thorisdottir sneak back up into 2nd place on the women's side? Top 11 on the past three workouts? Looking at the leaderboard right now, I think it's safe to say the women's side is going to be crazy-competitive at the Games this year.
Enough about the past, let's move on to 15.5. The Rx division of the Open this year is shaping up to be the heaviest (based on LBEL and average relative load) of all-time, by far. It's actually on par, right now, with what we typically see at Regionals. Normally I'd say this implies we'll get something lighter in 15.5, but I doubt that's the case this year. We've seen a progression so far in 2015 of the workouts getting more and more challenging each week, and I think that continues in 15.5. I also think this workout will be for-time, and I think they'll make use of most of the movements that have showed up in the past but not this year (burpee, thruster, box jump, row, push-up).
With that in mind, I am going to defer to my wife, who came up with this pick last night. It has everything I was planning to throw in, and if it ain't broke, why fix it?
3 rounds for time of row 500 meters, 21 burpee-box jumps (24"/20"), 12 thrusters (135/95)
As always, post SWAGs to comments, and enjoy the final workout (or workouts?) of the 2015 Open!
Thursday, March 19, 2015
One Chart: Scaling vs. Rx So Far in the Open
This one will be super-quick today, because I don't yet have the data and/or time to fully do this topic justice. Expect to see more on this in the Open recap posts in a month or so.

At the request of a couple people, I want to give a quick snapshot of how many athletes are scaling the Open and how many are going Rx. The trouble for me right now is that I don't have a downloaded version of the full leaderboard, so it's challenging to tell how many athletes have gone Rx in all the workouts. Athletes can scale one workout and go Rx on another, meaning the leaderboard is a mish-mash of both types of athletes, and the online version is not sortable in a way that I can get at this.
However, what I can do is look at how many athletes are scaling each workout. The suspicion among many is that far more athletes would be forced to scale 15.3 as compared to 15.1 or 15.2, and the numbers seem to bear that out. For simplicity, I looked at the Central East region, which should be a pretty representative sample of the worldwide field (again, I'll do this more properly once I have all the data downloaded). The chart below shows the entire field in each workout, split into Rx and scaled athletes.
It's pretty clear from the two bars on the far right that a lot higher percentage of the athletes had to scale on 15.3 as compared to the first two workouts, particularly among females. A mere 14% of women managed to complete 15.3 Rx'd, compared to 56% and 66% in 15.1 and 15.2 respectively.For men, 61% completed 15.3 Rx'd, compared to 83% and 84% in 15.1 and 15.2 respectively.
However, I think it is interesting that from week to week, the total field shrunk by about the same margin from 15.1 to 15.2 and from 15.2 to 15.3 (all between 11%-13%). Some may have expected that a lot more athletes would drop out entirely during 15.3 due to having to scale, but it doesn't appear that was really the case. These rates of attrition are very similar to what has been observed in the past few years. What will be interesting is how this changes moving forward: will athletes be more willing to scale after scaling 15.3, or will they eagerly jump back into the workouts Rx'd if possible? For women, there were actually slightly more Rx women in 15.2 compared to 15.1, so I imagine it's likely that many athletes will hop right back into the Rx field this week.
Note: I'm always looking for help pulling in the entire dataset. Several people have helped or volunteered their help in the past, so please contact me at anders@alumni.wfu.edu if you think you'll be able to help me out. Any help is much appreciated, and thanks again to all those who have helped me in the past.
Tuesday, March 17, 2015
Fun With SWAGs: What Will 15.4 Be?
Last week's SWAG was another half-way decent one that at least got the time domain close (15 minutes vs. 14 minutes) and got one movement right (wall balls), but it wasn't exactly spot-on. I certainly didn't predict that muscle-ups would appear first in 15.3, but as you'll hear on the podcast below, this wasn't something that came completely out of nowhere.
This week I double-down on an earlier pick, because it just seems too good to pass up this week, but I promise I won't make this pick again if it fails me again. I've got to believe this week will be short, intense, and I don't think we're quite ready to repeat any movements that have shown up yet. With that in mind, the official CFG Analysis SWAG for 15.3 (Rx'd division) is:
AMRAP 7 of burpee-box jumps (30"/24")
Remember to check out the podcast for as John Nail and I discuss 15.3, the controversy surrounding muscle-ups appearing as the first movement in an Open workout, how annoyingly hard single-unders can be, and of course, our picks for 15.4.
Please post SWAGs to comment. Even with so many movements off the table, it will still be quite the accomplishment to get 15.4 or 15.5, especially with HQ showing that the game has changed this year.
Also, be on the lookout this week for a short post later this week looking into how the effect of the 15.3 muscle-ups on the number of Rx vs. scaled athletes, and how it compares to past Open workouts in terms of thinning out the field.
Tuesday, March 10, 2015
Fun With SWAGs: What Will 15.3 Be?
Well I would have liked to pat myself on the back for having a relatively decent pick last week (it was a repeat, and it did include overhead squats), but since two of our readers got 15.2 exactly right, I guess I'm not so smart after all. Congrats again to JesseM (via comments section) and Kelcey Lehrich (via Twitter) for calling 15.2.
But enough about those guys. This is my week for glory. The Open really hasn't brought the pain yet, and I think this is the week HQ puts a beatdown on the community. Among Rx athletes, only about 14% of males and about 5% of females made it beyond the round of 14s this year*, so that means the vast majority of the field hasn't had a metcon that lasted longer than 9 minutes yet. And I think the first two metcons have been more about strategy and avoiding muscle fatigue, and less about engine. I think that changes this week.
The official CFG Analysis SWAG for 15.3 (Rx'd division) is:
AMRAP 15 of 15 row calories, 30 wall balls (20-lb. to 10'/14-lb. to 9')
Remember to check out the podcast for chatter with John Nail about 15.2 and more details about why our predictions for 15.3 are bound to come true. Plus we've got a short interview with soothsayer Kelcey Lehrich, he of the correct 15.2 prediction.
Please post SWAGs to comment. With another repeat workout (likely) off the table, a correct pick this week will be a true accomplishment (still no beer on the line, but perhaps we can work something else out).
*Last year, those percentages were 10% for men and 3% for women. So it appears the community is improving, although some of that could be influenced by athletes shifting to the scaled division this year. We'll look more into how continuing athletes improved in my Open review in a month or so.
Tuesday, March 3, 2015
Fun with SWAGs: What Will 15.2 Be?
So we weren't exactly close last week. I got almost no elements correct about 15.1 (including the fact that it was actually two workouts), although I will give myself a big pat on the back for correctly guessing that it would not be a repeat. That was brilliant on my part.
Anyway, that's not going to stop me from making a bold pick about 15.2 (it certainly never has in the past). For all the gory details about how I came up with this pick (along with all the latest on Kim Jong Un's brief stay at the top of the Open leaderboard and other 15.1-related chatter), listen to the podcast below or download it on iTunes.
The official CFG Analysis SWAG for 15.2 (Rx'd division) is:
AMRAP 10 of 60 bar-facing burpees, 30 overhead squats (120/90), 10 muscle-ups (i.e. repeat of Open 11.4)
[Update 3/5 - Fixed the women's weights on this workout to match 2011 exactly. Thanks to kentyman for the catch.]
Please post SWAGs to comment so that you'll be able to gloat later in the event that your guess is actually not way off. No beer on the line this week, unfortunately.
[Update 3/6 - Congratulations to JesseM (via comments section) and Kelcey Lehrich (via Twitter) for successfully predicting 15.2! And thank goodness I did not promise beer this week...]
Monday, March 2, 2015
Froning vs. Fraser (vs. Horwath) in 3 Charts
I'll have plenty more thoughts on 15.1 (and 15.1a) on the podcast tomorrow, and I may even go a little more in depth on the blog later this week as well, but I want to keep things short today. My preliminary analysis (and my intuition) is saying that this was a toes-to-bar workout, but that's not to say that was the only element that mattered at all. The snatch was also critical, and as we'll see below, transition time on the deadlift actually could be the difference between scores among elite athletes.
Consider three athletes: Rich Froning, Matt Fraser and Brian Horwath. Brian Horwath? Yes, Brian Horwath. As of 6 p.m. ET, he had the highest score on a video submission in 15.1 (229), and he attacked this workout completely differently than Froning (224) and Fraser (219). Horwath clearly didn't have the barbell strength that Froning and Fraser did, as evidenced by his 255-lb. clean and jerk in 15.1a (still quite respectable, don't get me wrong). In fact, he did singles on his snatches throughout the workout, but he made up for this with blistering speed everywhere else.
The three charts below show the pace of each athlete on each movement throughout the workout. Note a few things:
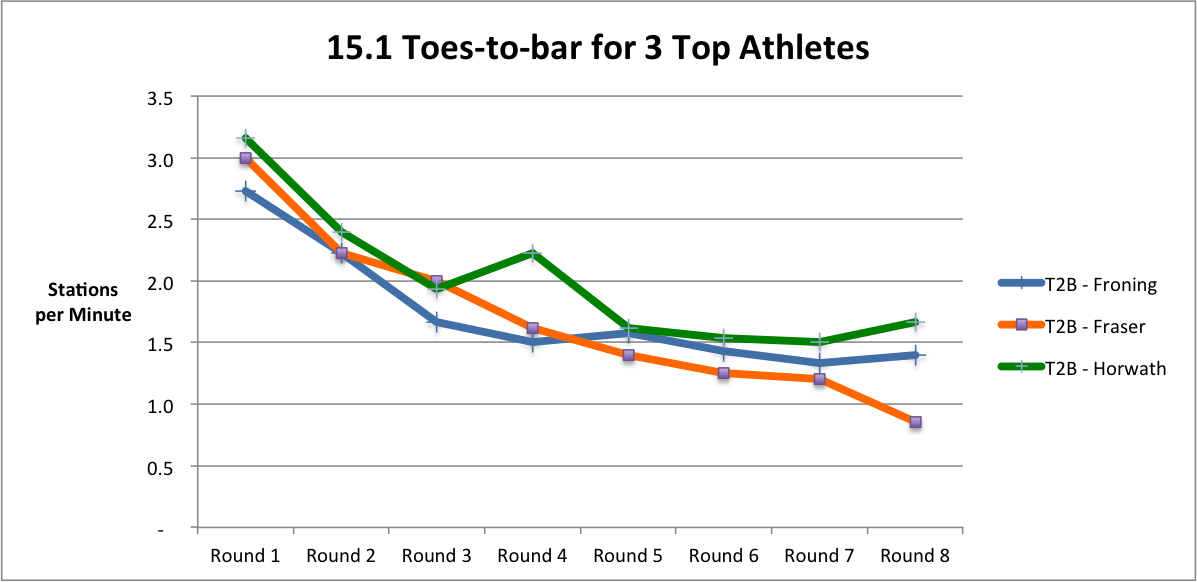
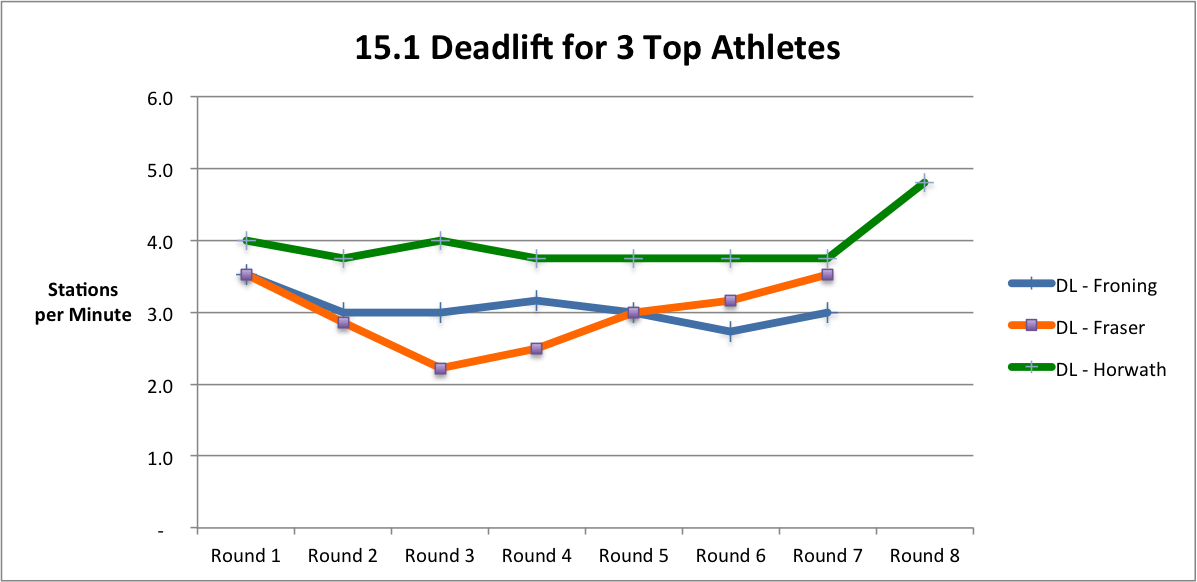
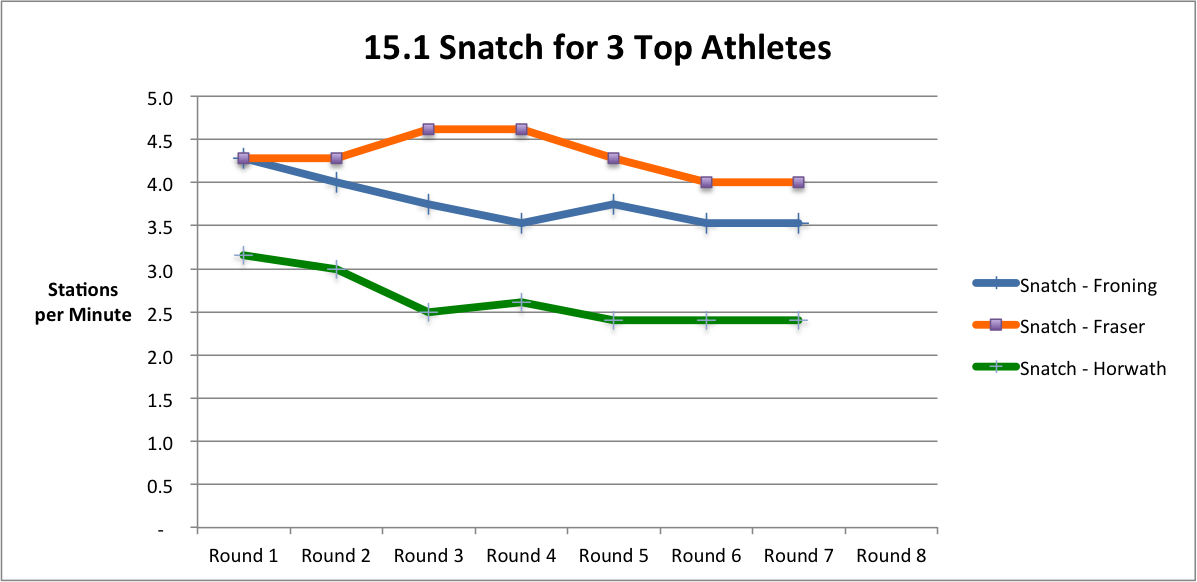
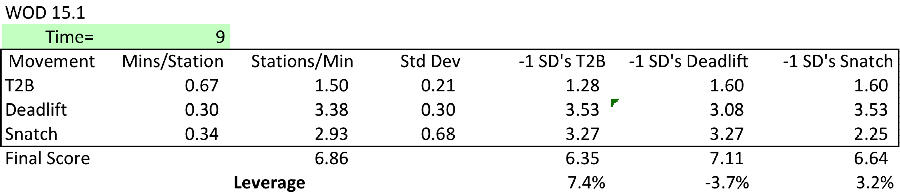
- The toes-to-bar degrade for all athletes here. There are few movements in CrossFit where this is as consistent as in the toes-to-bar. We saw it a few years ago in 13.4, and I see very few, if any, athletes who can consistently bang out sets of 10+ for a workout longer than 5 minutes.
- Horwath only goes a little faster than Froning and Fraser on the toes-to-bar, but he maintains that lead throughout. That small advantage was a big factor.
- Froning and particularly Fraser were much faster on the snatch. In the 10 or so videos I've watched, no one has come close to matching Fraser's speed on the snatch. In hindsight, maybe this was not the best strategy.
- Horwath blazed on the deadlift. Absolutely no rest whatsoever after getting off the pull-up bar. That saved him about 4-5 seconds per round on Fraser and Froning.
Remember, there are many ways to win a workout, and in the Open more than any other time, strategy matters.
[Update 3/7/2015 below]
I know we've all moved on to 15.2, but I finally was able to complete a reasonable analysis of how much each movement was valued on 15.1. I'll skip the deep background on this and instead refer you to this post and this post. Below are the results, based on a review of 9 elite-level male athletes (all scored at least 190 on 15.1 and hit at least 290 on 15.1a.)
The interpretation of this is that if an athlete goes 1 standard deviation slower than average on the toes-to-bar and 0.5 standard deviations faster than average on the other two movements, that athlete's score will be 7.4% worse than an athlete who is average on all three movements. In the deadlift column, this represents a scenario where the athlete is slower on deadlifts but a little faster on the other two movements. In the snatch column, this represents a scenario where the athlete is slower on snatches but a little faster on the other two movements.
What this is telling us is that athletes are punished most for a weakness on the toes-to-bar, followed by snatch, followed by deadlift. The spread here is pretty wide, and the deadlift showing a negative-3.7% leveraging is pretty amazing. If you're not very speedy on the deadlifts, it was not hard to make up for that on the other two movements. Conversely, if you struggle with toes-to-bar, you are in big trouble.
From the feedback I've received and seen online, this lines up very much with what people feel intuitively about the workout. The 7.4% leveraging (at 1 standard deviation) is actually slightly lower than the 7.8% leveraging I observed on 14.1 last year, but we all know that 14.1 was all about the snatch. And if we compare to what I saw when I looked at Jackie at the 2013 Regionals, the toes-to-bar in 15.1 was far more leveraged than any of those movements (in the original post I adjusted each movement by 2 standard deviations, but when I adjusted that to be 1 standard deviation, the highest leverage on any movement was the pull-ups for women at 2.2%).
Note that this type of analysis is quite time-consuming, so I don't do it that often. If split times became more easily obtainable, I'd like to do this on a more regular basis, as I find it quite fascinating and potentially useful for athletes.
Monday, February 23, 2015
So, I'm On Twitter Now...
Yeah, yeah, I know, I should have done this like 24 months ago... better late than never, right? Follow me @CFGAnalysis to stay updated on what's going on in CFG Analysis world.
Subscribe to:
Posts (Atom)