Note: For details on the dataset I am using, including which athletes are and are not included, please see the introduction to Part I.
For Part II of my look back at the 2013 Open, let's transition into looking to some results from this year's Open, while still keeping the programming in mind. As I mentioned in the intro of Part I, one way to judge the effectiveness of a workout (for competition purposes) is to see how well it correlates with success in a variety of other events. In other words, an event is "good" if the best athletes tend to finish near the top. Although we don't yet have regional results to add to the mix, we can still look at how well each event predicted success in the other four Open events. By this metric, event 13.4 was probably the best test this season. For the entire field, a male athlete's rank on 13.4 was 91% correlated with his rank on all other events combined (for women, 90%). All other events ranged between 83-86% for men and 80-88% for women.
For Part II of my look back at the 2013 Open, let's transition into looking to some results from this year's Open, while still keeping the programming in mind. As I mentioned in the intro of Part I, one way to judge the effectiveness of a workout (for competition purposes) is to see how well it correlates with success in a variety of other events. In other words, an event is "good" if the best athletes tend to finish near the top. Although we don't yet have regional results to add to the mix, we can still look at how well each event predicted success in the other four Open events. By this metric, event 13.4 was probably the best test this season. For the entire field, a male athlete's rank on 13.4 was 91% correlated with his rank on all other events combined (for women, 90%). All other events ranged between 83-86% for men and 80-88% for women.
If we limit the field to the top 1,000 finishers for men and top 500 finishers for women (roughly 2% of the final field for each), re-rank everyone, then look at the correlations, they do drop off. This makes sense, because it is not inconceivable that a top athlete might fall toward the bottom of that elite group on one event, but a top athlete falling anywhere beyond the top 5-10% across the entire field is unlikely. Looking at the events across this elite group, 13.5 had the highest correlation for men at 39%, while 13.4 was still highest among women at 53%. Among this elite group, 13.2 proved to be the weakest test for both men and women (23% for each), which is not particularly surprising to me. The difference between top scores on this workout often came down to tiny fractions of a second on each rep, not to mention that the was widespread variation in judging standards on this one (which has been discussed on the internet ad nauseum already).
To put these numbers into some context, I looked at the correlations for the five events last year for the men's field. Across the entire field, events 12.3, 12.4 and 12.5 had correlations between 81-88%, but the two single-modality workouts, 12.1 and 12.2, only had correlations of 69% and 63% respectively. Limiting the field to the top 500 (roughly 2%), the correlations for 12.1 and 12.2 were just 15% and 12%. Not to beat a dead horse, but the multi-movement events just give us more information about the athletes, which is key in an competition as short as the Open.
Visually, these scatter plots help illustrate the idea. Each chart shows a random sampling of about 500 athletes from across the entire field (because showing them all would be too much for Excel, which is why I need to improve my R skills). On each chart, the location on the x-axis represents the athletes's rank on that event, and the location on the y-axis represents that athlete's combined rank on all other events. Notice how much more of a clear relationship we have in 13.4 as compared with 12.1. Virtually no one did amazingly well on 13.4 without also performing solidly across all five workouts.


Moving on, with the 2013 Open web site being set-up in conjunction with last year's site, it was much easier to track which competitors were returning and which were new. With that information available, I was curious to see how the returning athletes fared as compared to the first-timers. Would they have more of an advantage on certain events. 13.3 perhaps? Let's see.*

Simply put, the returning athletes did fare better than the newcomers (lower percentiles in this case mean a better ranking). However, the difference was not markedly different on any one event. I anticipated that returners would have an even bigger advantage on 13.3, given that it was in last year's Open, but this does not appear to be the case. Interestingly, among the top 1,000 male finishers, new athletes actually fared slightly better than returning athletes on 13.2. This is the only event where this was true, and it was actually not true for women.
What would be ideal here is to have the age for each competitor so I could control for any differences in the age mix between the three categories of athletes, but alas I do not have that information at the moment. My hunch is that the age mix is likely pretty similar between the three groups, however.
Since 13.3 was an exact repeat of 12.4, it should provide some good insight into how the community is progressing over time. In order to better compare performances on most events, I like to adjust the scores to be in terms of stations. So in this case, 150 wall balls is 1.0 stations, 90 double-unders is 1.0 stations and 30 muscle-ups is 1.0 stations. For this event in particular, this isn't a perfect solution, because 90 double-unders is a considerably shorter station than the other two, but I think this still gives us an improvement. We know that 1 wall ball is much less difficult than 1 muscle-up, so we try to reflect that.
After making that adjustment, I compared the distribution of scores across all competitors on 13.3 vs. the distribution of scores across all competitors on 12.4. The charts for men and women are similar, but since I've been showing men first up to this point, let's show the graph of the ladies here. The chart below is basically made up of two histograms, which I've shown as line because it makes it easier to compare their shapes. I've also omitted scores below 0.75 rounds (113 reps) because the graph tails off quickly and then has a spike at the very bottom due to all the scores of 1.
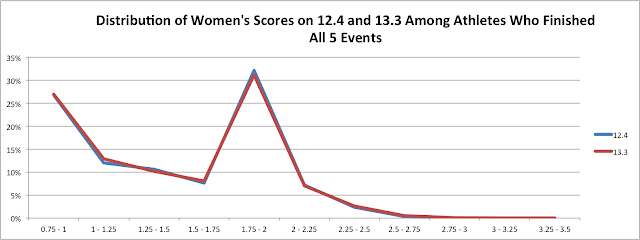
I found this truly remarkable. Despite doubling the size of the field this year, the scores across the entire community were distributed in nearly identical fashion. Additionally, the percentage of women completing a muscle-up inched up from 9.9% to 10.2%, and the percentage of women completing a muscle-up of those that reached the muscle-ups ticked up from 27.0% to 28.6% (these numbers are not easy to discern from the graph). For the men, the percentage completing a muscle-up actually dropped from 37.1% to 35.6% and percentage completing a muscle-up of those that reached the muscle-ups stayed flat at 73.6%. So essentially, no real change from last year.
Does this mean that CrossFit somehow doesn't work? Are athletes not improving at all with a year's worth of training? No. What it means is that the newer athletes are coming in and putting up scores at the lower end of the spectrum, offsetting the athletes who competed last year and are improving. How do we know this? Well, let's look at the same chart as above, but this time only with athletes who finished all five events in 2012 and 2013.

You can clearly see that the distribution of scores on 13.3 is heavier at the higher end than the distribution for 12.4. For instance, you can see that about 15% of athletes scored between 2.0-2.25 (240-247) on 13.3, while only about 8% did so on 12.4. Further, the percentage of women completing a muscle-up jumped up from 12.6% to 23.9%, and the percentage of women completing a muscle-up of those that reached the muscle-ups went up from 30.2% to 40.9%. For the men, the percentage completing a muscle-up skyrocketed from from 49.8% to 70.9% and percentage completing a muscle-up of those that reached the muscle-ups moved from 77.8% to 85.3%. Clearly, the athletes who came back this year worked on wall balls, double-unders and muscle-ups, and it paid off on 13.3.
Finally, let's wrap things up by taking a look at how many athletes stuck with it through all five weeks of the Open. As has been noted in the past, scores from athletes who only compete in the first event or two are not removed from the standings for the weeks in which they did compete. Although strangely, athletes who skip week 1 but compete later do not count at all. I would argue this is not exactly fair, as the first events essentially get weighted more because the size of the field is larger. My analysis, however, did not show that this would have had a significant effect on the final rank of competitors.
Still, it is interesting to look at when and how rapidly athletes drop out of the field. Here are stacked bar charts for the men and women in this year's field. If an athlete returns to the field after dropping out, that score after returning does not count in my analysis.

You can see only thing out of the ordinary there appears to be the number of women finishing the first 3 events. My hunch is that this is due to the large number of women who could not complete a 95-lb. clean and jerk. In fact, let's look back at how the field tailed off for men and women the past two years, from a slightly different perspective.

Again, the only drop that looks out of line is the women going from 13.3 to 13.4. Between those events, the field shrunk by 19%. In the past two years, the next-largest drop was 13% (men between 13.4 and 13.5), and all others were between 9% and 11%. I would have liked to look back at 2011 to see if a similar percentage dropped off from 11.2 to 11.3 (the heavy clean and jerk), but the 2011 Games site is considerably more challenging to handle. If anyone has an answer there, I'd certainly be curious.
Anyhow, that's it for now. There may be more topics to re-visit from this year's Open, but I think it's time to focus our attention to Regionals (even for the vast majority of us who won't be competing). See you all in a few weeks when the events are announced!
*"Returning incomplete competitors" refers to those who started last year's Open but did not complete all 5 events.