Follow me on Twitter!


Friday, December 20, 2013

Are CrossFitters Specializing?

For the past seven years, the CrossFit Games have sought to find the fittest all-around athletes in the world. One common theme from CrossFit HQ is that the Games seek to "punish the specialist" and "reward the generalist." However, one can't help but notice the increased attention that certain aspects of fitness seem to garner in the CrossFit community compared to others. In CrossFit media, the emphasis on lifting, and Olympic lifting in particular, seems to be disproportionate to many other areas of fitness. When was the last time you saw a video or even a note on the Games site mentioning a Games athlete hitting a new PR in his 5K run? Yet it seems like it hasn't been 24 hours since we've seen a video posted of another athlete hitting a big snatch or clean and jerk.

OPT noted this phenomenon on his blog about a year ago:

"Media recently for the sport has put an emphasis on strength development in spite of promoting true “balance” in fitness and the general components of fitness.  A sport where now the elite can qualify for the American open weightlifting championships but cannot qualify for a state-level high school cross country meet."

Although I won't seek to prove it in today's analysis, I think there is little doubt that the big lifts tend to get a lot more attention than general metabolic conditioning in CrossFit media. However, the question I will attempt to answer is whether the sport itself has gotten out of balance.

From the programming perspective, I showed in my recent post "History Lesson: An Objective, Analytical Look at the Evolution of the CrossFit Games" that while the metcons have become heavier and heavier over time, the overall balance of lifting and conditioning has not changed drastically in the past 7 years. In addition, there is roughly the same amount of emphasis on Olympic lifting now as there has been throughout Games history. In fact, there has actually been a shift away from the powerlifting-style movements like the deadlift and back squat. Running is and has always been the most common movement at the CrossFit Games.

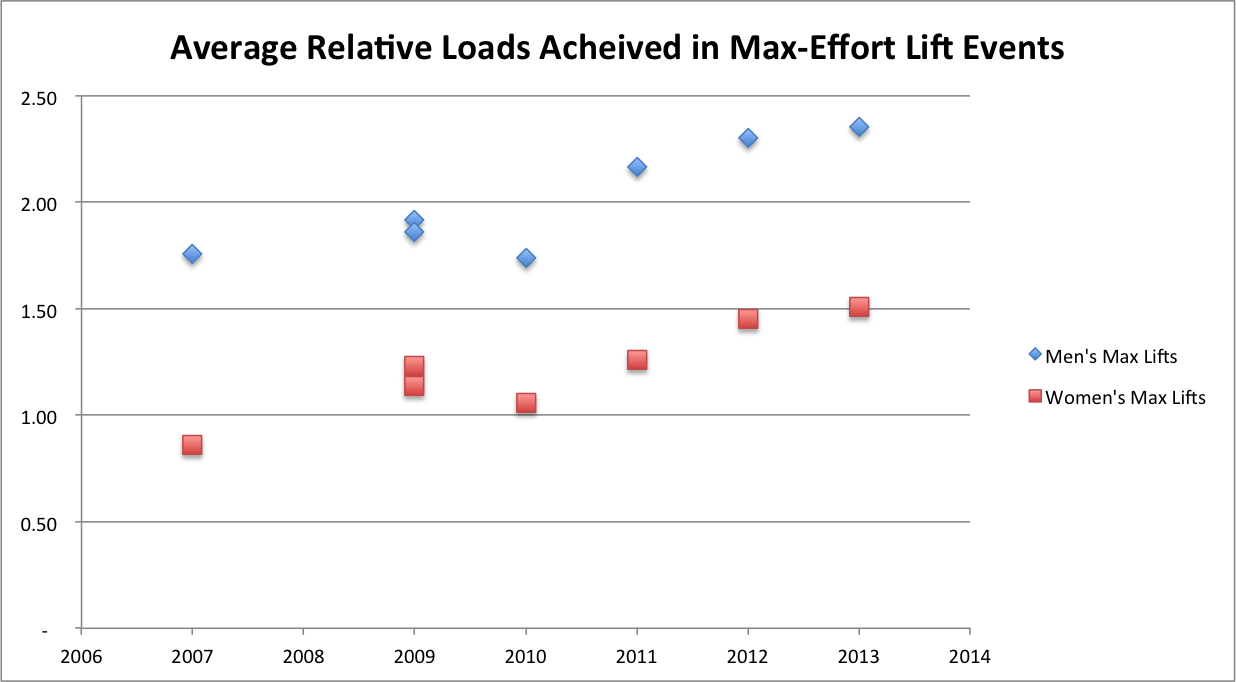
However, there is a legitimate question about the intense focus on Olympic lifting and the lack of focus on running at the Regional level. And there is also no doubt that the CrossFit athletes have been getting more and more proficient at the Olympic lifts, as evidenced by the rising numbers in the 1-rep max events at the Games each year.

So let's ignore the programming for now and focus on the actual strengths and weaknesses of the athletes in our community. Before I do this, I want to re-visit the comment from OPT above. I love OPT and have probably watched every CrossFit.com video of his over the past few years, but I think the commentary that "the elite can qualify for the American open weightlifting championships but cannot qualify for a state-level high school cross country meet" is a bit misleading on a couple of levels:
  1. The American Open is not that competitive on a global scale. To qualify in the 85 kg weight class, you need a 266 KG total (http://0205632.netsolhost.com/2013NationalEventsQualifyingTotals.pdf). Yet at the 2012 Olympics, the 16th place finisher had a total of 315, or 18% higher. On the other hand, to qualify for the highest-level state cross country meet in Ohio (a competitive state where I used to cover sports), you need a time around 17:00. Considering these meets are run on rugged terrain rather than on a track, this time isn't that far behind the Olympic 5,000 meter times (13:52 was 15th place in the 2012 Olympic final). So I think it could be argued that qualifying for those two events are actually relatively comparable as far as difficulty.
  2. There are weight classes in Olympic weightlifting, yet there are not in CrossFit or cross-country. The top CrossFitters are not even in the same stratosphere as the lifters in the 105KG+ weight class. On the flip side, among runners above 200 lbs., I have to believe someone like Garrett Fisher would be considered elite.
But let's look at the numbers throughout our community. To do this analysis, I used the 2013 Open data, which was generously pulled and cleaned for me by Michael Girdley (girdley.com). This dataset has all the numerical information provided by athletes who competed in the Open (it does not include answers to the questions about diet, how long you've done CrossFit, etc.). Based on this self-reported data, I believe we can understand how CrossFit athletes from top-to-bottom compare to the world's best in a variety of lifts, running events and metcons.

To perform this analysis, I first limited the data to athletes under 40 who completed all five events (approximately 39,000 men and 23,000 women). Then I re-ranked all the athletes based on their rank across all 5 Open events and grouped them into 20 buckets based on this rank. Within each bucket, I took the average for each of the self-reported scores (Fran, Helen, Grace, Filthy 50, FGB, 400 meter run, 5K run, clean and jerk, snatch, deadlift, back squat, max pull-ups). For the timed events, I converted these to a pace (rounds per second, for instance, or meters per second). Then, I pulled in world records for each and compared the CrossFit community against those world records.

The charts below shows how the community compares to the world records*. For the lifting events, these are the world records without regard to weight class, since CrossFit does not have weight classes. To reduce clutter, I have grouped all metcons together, all runs together and all lifts together (pull-ups stayed in their own category).


On both charts, we can see that the community is generally closest to the world record when it comes to running events and (not surprisingly) metcons. When compared to the world record in the lifts, it becomes obvious how far behind the CrossFit world still is. Proud of that 200-lb. snatch? Congratulations, you are slightly below half the world record. (Note: I am proud of my 200-lb. snatch, and it took me 5 years to finally get there).

But let's also look at the Games athletes in particular and see how they stack up. Here is a table showing each event and how the average Games athlete stacks up compared to the world record.


Not shockingly, the Games athletes are near the top to the world record in the metcons (since generally the world record comes from this field), but again, note that they are much closer to the world records in the 5K run and the 400 meter run than they are in the Olympic lifts. And look at that back squat - not even close! (and before you ask, this is comparing against the raw world record in the back squat, which appears to be 450 KG as best I could tell)

It is interesting to note that the elite CrossFit men are closer to the Olympic lifting world records than the elite women, yet they are further from the 5K run record. This could have something to do with the background that many of the athletes had prior to CrossFit, but that's purely a guess at this point.

Another way to look at this is to understand where the Games athletes excel furthest beyond the rest of the community, and in particular, where they excel furthest beyond the rest of the Regional field. For both men and women, here is a look at how the top 5% of Open finishers (roughly the Regional field) compared to the Games athletes.


Here I think we start to see something interesting. While the Games athletes do not appear to be any further from the world record in the 5K run than they are in the Olympic lifts, they aren't that much better than the rest of the regional field when it comes to the running events. They also aren't that much better when it comes to the powerlifting movements. I think you could attribute at least partially to programming at the Regionals: we simply aren't testing much for running or powerlifting, so the athletes making the Games aren't necessarily that much better than the rest of the field in those areas.

On the flip side, look where the Games athletes do exceed their peers by a greater amount: the Olympic lift, the short metcons and pull-ups. It seems that explosive power and conditioning (over a relatively short time frame) are what tend to separate the Games athletes from the rest of the Regional field.

One last way to look at this is to see the gap between the Regional athletes and the median Open athlete**, which is defined as the athletes finishing in 45th-55th percentile in the Open among people under 40 who completed all 5 events. These median Open athletes are still generally fit individuals, they just aren't quite at the Regional level.


This table looks a lot like the prior one, meaning that what separates the Regional athletes from the average Open athletes is a lot like what separates the Games athletes from the Regional athletes.

Based on the analysis here, I believe that CrossFit athletes in general aren't bad runners or particularly tremendous lifters. However, the elite CrossFit athletes are significantly better lifters than the rest of the community, and yet they are not drastically better runners than the rest of the community. From this perspective, we do see a little bit of the bias that OPT was writing about. But overall, I don't think the specialization issue is as much of a concern as some might think.

Update 12/20: [I'd like to note that I don't believe that achieving 70% of the world record in the snatch is exactly as challenging as achieving 70% of the world record pace in a 400 meter run. However, the fact that CrossFit Games athletes are so much closer to the world record in the running events than they are in the lifts indicates to me that these athletes should not be considered specialists in the Olympic lifts who simply neglect running. One way to quantify this, which I'm hoping to look into more, is to put things in terms of standard deviations. I have looked at this for the snatch, clean & jerk, 5K run and 400 meter run for men, however. Using the standard deviation based on the same sample of Open athletes under 40, the Games athletes are approximately 6.0 standard deviations below the world record in the lifts but only 4.3 standard deviations away in the 5K run and 2.0 standard deviations away in the 400 meter run. This isn't a perfect method either, but again, it supports the idea that Games athletes aren't totally specializing in the Olympic lifts while neglecting their running.

However, I do see the same pattern as in the main body of my post when comparing Games athletes to the rest of the CrossFit field. Games athletes are only about 1.1 standard deviations better than the median in the 400 meter run, 0.7 standard deviations better in the 5K run, but approximately 2.5 standard deviations better in the Olympic lifts. So it seems that the same conclusions generally hold when doing the analysis this way.]


Update 12/21: [As a follow-up to the previous update, I looked at where the average Games athlete would fall in the spectrum of all Open athletes in each of the self-reported metrics. This was more difficult than it might seem because of the tremendous selection bias in the data (only about 20% of the men's field reported a 400m time, for instance, but about 50% reported a deadlift max). I tried to account for this by creating a "weighted" distribution, where each 5% bucket was only worth the same number of total athletes, regardless of how many missing values they had. After doing this, I found that the average male Games athlete is in the top 2% in the clean and jerk and snatch, and they were at least the top 6% in all other lifts or metcons. However, for the 400 meter sprint, they were only in the top 15%, and in the 5K run, they were only in the top 25%.

Note that the selection bias still can't be totally accounted for. It's probably fair to assume that the non-responders in general had worse scores than those that did respond, so maybe the Games athletes are actually even better than they appear here. However, it is definitely striking that the Games athletes are not that far beyond their peers in the runs, particularly the 5K. Still, it doesn't necessarily say they are bad runners, as you could argue that CrossFitters in general are good runners and therefore the Games athletes are still pretty good. It is clear, however, that Games athletes are outdistancing their peers substantially in the Olympic lifts, even though they are generally still well short of elite status. 

I think a lot of this has to do with the background of many CrossFitters. Many, many people ran to stay in shape prior to finding CrossFit, but relatively few Olympic lifted. To really decide if you feel the sport of CrossFit has gotten too specialized, I think all of the preceding analysis has to be taken in together, including how far CrossFitters are from the world records as well as how the Games athletes compare to the rest of the field. I'm not sure there is really a clear-cut answer.]

Update 12/28: [Quick one here. I did the same analysis for the women that I did for the men on 12/21, and I found that the women's Games were slightly more dominant across the board. The average Games athlete would be in the top 3% for all lifts and metcons, the top 9% for the 5K run and the top 15% for the 400 meter sprint. Interesting that they were comparatively better than the men in the 5K, although actually about the same in the 400 meter sprint. I'm not sure I really have a good hypothesis for this at the moment.

Also, worth noting is that I looked into the response rates for each metric, and found that for women, the rate was between 7% and 12% for all runs and metcons, except Fran, which was 17%. The response rate was between 32% and 38% for all the lifts and 16% for max pull-ups.

For men, the rates were between 13-23% for all metcons, except Fran, which was 33%. The response rate was between 44% and 51% for all the lifts and 30% for max pull-ups.

This does indicate that there is a selection bias issue that has to be considered, but it's not as if it ONLY applies to the runs. Basically all the metcons and the runs had very low response rates, but the lifts had much higher response rates.]

*Here are the world records I used in this analysis, based on a combination of web research and self-reported PRs from the database: 
Fran - 2:00 (men), 2:07 (women)
Helen - 6:13, 7:20
Grace - 1:14, 1:17
Filthy 50 - 14:05, 16:13
FGB - 520, 460
400 meters - :44, :50
5,000 meters - 12:37, 14:11
Clean & Jerk - 263 KG, 190 KG
Snatch - 214 KG, 151 KG
Deadlift - 461 KG, 264 KG
Back squat (raw) - 450 KG, 280 KG
Max pull-ups - 106, 80

**There is a significant amount of selection bias in these self-reported numbers, which is why I used the bucketing approach to account for it. In general, the people reporting their numbers for each lift/run/metcon are better at those lifts/runs/metcons than those who leave them blank. Also, for many of the metcons, less experienced athletes may not even have a PR. As an example of this bias, if you take a straight average of the clean and jerk across all women under 40 finishing all 5 events, it's about 134 pounds. But if you group the field by the 5% buckets as I have, take the average in each bucket, then average across all buckets, you get an average of 126 pounds, which I believe is more representative of the "true" average.

Monday, November 4, 2013

What to Expect from the 2014 Open

As of the date of this post, we have about 5 months remaining until the 2014 CrossFit Games Open begins, give or take a week or two. Planning to compete this time around? If so, you'll probably be well-served to have some idea of what to expect when March rolls around.

While we can't know for certain what Dave Castro and HQ have in store this year, we have plenty of data from the past three years that can inform us about what the Open is likely to look like. How you go about training for those events is another topic altogether (one I touched on briefly last year in my post "Does Our Training Look Like What We're Training For? Should It?"), but in any event, it's better off not to go in blind. We know CrossFit is all about preparing for the unknown, but here's a hint: if you actually want to do well in the Open, I'd worry more about getting your burpees and snatches in order  and less about those pesky ring handstand push-ups.

In many ways, today's post will be an update to last year's post "What to Expect from the 2013 Open and Beyond." However, I plan to expand on certain topics a bit more and really focus the discussion on the Open. We'll cover the Regionals and Games another day (you can read my most recent post for plenty of discussion of the Games programming). For those just getting into CrossFit after seeing the Games on TV, here's a quick and VERY important note: the Open workouts will not look much like what you saw on TV. But even the athletes who made it that far had to master this stuff first.

OK, with that out of the way, let's get started. The easiest way I see to do this is to answer the questions that any athlete should have as he or she prepares for the Open.


What movements will I need to do?

Good question. While the Games have used a total of 51 different movements in the past, the Open is testing a much smaller skill set. There have only been a total of 14 movements used in the Open in the past three years, and 10 of those have been used every year since the Open started in 2011. Below is a breakdown of the movements that have been used in the Open in the past, and thus the movements you can expect this year. The table shows the percentage of the total point value that each movement was worth each year, along with an estimate of how much they'll be worth this year. The projection for this year takes all three years into account but gives more weight to the more recent years.


Right there at the top, the top five lifts (snatch, burpee, thruster, pull-up and jerk) account for over 50% of the points. Get really good at those movements, make sure you don't suck at toes-to-bar, box jumps, double-unders, wall balls or muscle-ups, and you should do well in the Open.

Now, you'll notice I have a "Subcategory" listed for each lift (I know a wall ball isn't actually KB or DB, but I put it in there because it's a lift that doesn't use a barbell). I find that looking at things based on the subcategory can be useful, because it gives us an idea of the type of movements that will be used. For instance, cleans haven't actually been used that much in the Open the past two years, but I wouldn't recommend skipping them in training - the movement pattern is similar to that of a snatch, which is highly valued. Below is a table similar to the one above, but looking at subcategories instead of specific movements.


Clearly, the focus is on two things: Olympic-style lifts and basic bodyweight gymnastics. This is partly due to equipment restrictions in the Open, but partly due to the fact that HQ seems to really value those two types of movements when making the first cut of athletes. This distribution changes quite a bit when we move into the Regionals and Games, but for now, we're focused on the Open.


How heavy will the lifts be?

I came up with the concept of average relative weights last year as a way to understand this topic a bit better. You can read the full write-up on how I've done this in last year's post "What to Expect from the 2013 Open and Beyond," but here's the concept: depending on the movement, a certain weight may be heavy, medium or light, so I have normalized the weights prescribed on each workout so that we can get a fairer indication of how "heavy" the lift was. After looking at the normalized loads that were prescribed in the past three years, I applied the average relative weight we've seen to the various lifts to show the average expected weights in this year's Open.


Now, while the above graph is useful, there are a couple other factors to consider:

  • These are only averages. The "heaviest" load required in the Open was a 165-lb. clean and jerk (squat clean and jerk technically), which is roughly equivalent to a 130-lb. snatch, a 290-lb. deadlift or a 145-lb. overhead squat. I personally doubt we'll see that type of loading required in the future.
  • HQ has twice programmed workouts where the weight starts light (to allow everyone to participate) but gets progressively heavier. For those looking to make the Regionals, you'll likely need to be able to move weights that are about 75% heavier than the loads shown above (for instance, 165-lb. snatch for men).
  • For some reason, HQ hasn't gone heavy on the movements you'd expect, like deadlift. I'm guessing this could be a way to allow more people to compete who may only have access to a limited amount of weight. So honestly, I'd be a little surprised if we see a 225-lb. deadlift in the competition, although it would seem like a reasonable weight to me.
The chart below illustrates the distribution of weights that have been required in the past (so, ignoring the 135-, 165- and 210-lb. snatches that could be performed in 12.2 and 13.1). Above each bar on the chart, I've given some examples of the type of movement/loading combinations that would fall into that range (sorry for the crappy resolution on this one, Excel for Mac is pretty awful about text boxes on charts).


What types of WODs will be programmed? Will there be any fun chippers like "Filthy Fifty?"

To answer the second question first, no, there probably will not be any fun chippers. HQ has made it clear that they believe couplets and triplets are the bread-and-butter, so get any thoughts of a "Filthy Fifty" out of your head now. Also, they probably won't program "Murph" (at least, I certainly hope not).

In the past three years, we've seen 16 workouts:
  • All have included either one, two or three movements
  • All were metcons (no max-effort lifts)
  • All were between 4 and 20 minutes
The chart below shows the duration, number of movements and load-based emphasis on lifting (LBEL) for each workout in the past three years*. The LBEL is a metric that tells us not only how heavy the loads were, but what percentage of the workout was based on lifting. So if the workout had 135-lb. cleans and burpees, the average relative weight is 1.00 but the LBEL is 1.00x50% = 0.50.


You'll notice that as the workouts get longer, the weights tend to decrease and the number of movements tends to increase. This is in line with what we typically see in CrossFit programming. Programming 7 minutes of burpees (Open 12.1) is torturous, but not unreasonable; programming 20 minutes of burpees is stupid (and dangerous, quite frankly).


OK, well, you did all this research, why can't you just tell us what the workouts will be?

Because I'm not Dave Castro, and ultimately, what happened in the past doesn't necessarily impact what will be coming in the future. There's nothing stopping HQ from saying "screw it, we're going to start requiring weighted pistols in the Open."

That being said, the Open has tended to be pretty predictable. After I published last year's version of this post, in which I emphasized how much value was placed on burpees and snatches, guess what showed up in the first workout last year? 17 minutes of burpees and snatches. My guess is that HQ's not really trying to trick us in the Open. They save that stuff for the Games.

So do with this information what you will. I'm not telling you how to train, I'm just telling you what you should be training for.


On a personal note, this may be my last post for a couple months, potentially until the Open starts. My wife and I are expecting our first child in the next few weeks, so I'm not exactly sure where blogging about CrossFit will fit into the schedule in those first couple months. We shall see. In any event, good luck with your training!


*Note that for this chart, I considered Open 11.1 a single-modality despite technically being a clean and jerk. Also, in calculating the LBEL for the snatch workouts with varying weights, I took the average weight lifted for someone who reached regionals. This reflects the fact that, while only 75 lbs. is required, for a regional-level athlete, they'll be moving somewhere around 130 lbs. on average throughout the workout.

Friday, September 27, 2013

History Lesson: An Objective, Analytical Look at the Evolution of the CrossFit Games

I can't say that I've been following the CrossFit Games from the very beginning. Living in the Midwest, there were hardly any affiliates in this part of the country when the inaugural Games took place in summer 2007. But I have been on board for quite a while: after starting CrossFit in fall of 2008, I watched about every video highlight available for the 2008 Games and followed the 2009 Games "live" through the updates on the Games website.

I've also competed in the qualifying stages of the Games each year since 2010. As anyone who has competed for that long can tell you, the Games have come quite a ways. The stakes have been raised, athletes have become more committed to the sport and the level of competition has improved dramatically. The growth of the sport has been well-documented, but it hasn't necessarily been quantified in a way that makes it easy to see the evolution of the sport and the potential progression in the future. I've spent the last few weeks gathering data in hopes of looking at the history of the CrossFit Games from an objective, analytical perspective.

For starters, let's take a look at the growth of the CrossFit Games.


Clearly, your shot at making the CrossFit Games has gotten worse as each year passes. But you will probably notice a pattern: in the past three years, the Games and the qualifying process has become much more standardized. The sport is still growing, but HQ seems to have found a format they like (three-stage qualifying, with the finals comprised of 12-15 events at the multi-purpose Stub Hub Center).

One thing people seem to notice about the Games is that the athletes seem to be getting stronger every year. One way to quantify this is to look at the results for all of the max-effort lifting events in the past 7 years. For each event, I have converted the average weight lifted to a relative load based on typical relativities between the movements. For instance, a 135-lb. clean, a 100-lb. thruster and a 240-lb. deadlift are each a 1.00. These relativities are based on data I've collected from athletes I know, as well as a few Games athletes. (I'm always looking for more data to improve these estimates, so feel free to shoot me an email with your maxes if you'd like to help out - I'll never reveal any individual's lifts).

Let's take a look at the average relative loads over time* (at the Games finals only).


Each event was slightly different (for instance, the 2010 lift was a max shoulder-to-overhead within 90 seconds of completing the Pyramid Helen workout), but it's clear that the progression is headed upwards. Certainly we'd expect that to flatten out over time, but it may be a few years before that happens.

However, does this mean the Games favor bigger athletes more now than in the past? That's a tricky question, but the short answer is, "not exactly." For starters, I looked at the average weight of the top 5 male athletes each year, and the heaviest year to date has been 2009 (201.0, and all were over 200 except Mikko). The past two years, the average has been around 199, but in 2010 and 2011 it was near 180. And we've never seen a champion that was among the biggest athletes in the field.

But let's also look at the programming. The chart below shows the historical experience for two metrics: load-based emphasis on lifting (LBEL) and metcons-only average load (both for men's competition only - the women's loading is generally scaled down 30-40%). If you're not familiar with these metrics, I recommend reading my post from last fall titled "What to Expect From the 2013 Open and Beyond" for more detail. But essentially, the LBEL tells us how much emphasis was placed on heavy lifting throughout the competition and the metcons-only average load tells us how heavy the required lifts were during the metcon events. LBEL is generally lower because it takes into account bodyweight movements (relative weight of 0.0), whereas the metcons-only average load focuses only on the lifting portion. LBEL also includes max-effort lifts.


Although there is a decent amount of fluctuation each year, the rolling 3-year averages help to understand the trends. I think this sheds some light on the discrepancy between what seems to be happening (Games are getting "heavier") and what is really happening (overall emphasis on heavy lifting is relatively flat). There is no doubt that the loads that are required of athletes during the metcon events are getting heavier (hello, Cinco 1?). However, two factors are offsetting that to keep the LBEL flat or even declining slightly: max-effort events make up a smaller portion of the total score and bodyweight movements are being emphasized more frequently.

To address the first of those two issues, simply look at the number of max-effort lifts each year. We've had one each year except 2008 (0) and 2009 (2), but the number of total events continues to rise. Thus, a killer 1RM may win you an event these days, but that's less than 10% of the total score, whereas it was a whopping 33% of the competition in 2007!

The second issue is best shown graphically. The chart below shows the percent of the points that were based on bodyweight movements vs. lifting in each year of competition.


You can see the emphasis actually shifted to 50% lifting or more from 2008-2010, but it's been more focused on bodyweight movements ever since. Now, one thing to keep in mind is that the regional stage of competition has been much more focused on lifting than the Games, so it is likely true that we are seeing bigger athletes qualify for the Games. Still, the bigger athletes are not necessarily at an advantage at the Games.

For me, as I worked my way through this analysis, I often found it helpful to view the history of the Games in three time periods: the initial years (2007-2008), the early qualifying years (2009-2010), and the Open era (2011-2013). In particular, I think grouping things into those time frames is helpful as we look at the final two other aspects of the programming: time domains and types of movement.

As far as time domains go, the Games have generally had an average time for most events of 12-15 minutes, and I doubt that will change in the near future. That being said, the distribution has varied quite a bit, from the 2008 Games where almost everything under 5:00 for the winner to the 2012 Games where we had a 2-hour triathlon. The chart below shows the distribution of time domains in the three time periods mentioned above.


What we're seeing is that HQ is now looking to hit the extreme ends of the spectrum more than in the past. Instead of hammering that medium range, it seems they would rather go super-long occasionally, go short-to-medium a lot and occasionally touch on the fairly long metcons. This is interesting because the typical CrossFit program probably focuses heavily in the 15:00-25:00 metcons, but these are rare at the Games these days (in the 2007 Games, they were common). Also, while we're seeing fewer max-effort lifting events (as a percentage), we're seeing more non-metcon bodyweight events, such as max-effort sprints and jumps, so the sub-1:00 category is relatively stable.

The one aspect that we haven't yet touched on is the type of movements that are being programmed. The first way I like to look at this is to group movements into seven major categories: Olympic-style barbell lifts, Powerlifting-style barbell lifts, basic gymnastics, high-skill gymnastics, pure conditioning, KB/DB lifts and uncommon CrossFit movements. A full listing of what falls into each category can be found at the bottom of this post. Let's see how these movements were distributed in the three time periods described above.


What stands out to me is the shift away from Powerlifting-style barbell lifts, and to a lesser extent, basic gymnastics. What has filled the void for the decline in those categories has been more high-skill gymnastics and uncommon CrossFit movements. I actually anticipated that the data would show that Olympic lifting is emphasized more now than in the past, but that's not really true. At the Games these days, you don't see as many classic Crossfit.com-style metcons. Instead, you see a lot of challenging gymnastics moves (handstand walks, muscle-ups) and some things like swimming, biking and sled pulls/pushes that aren't typically programmed much in CrossFit training. I think we started to see this shift in 2009 with the "Unknown and Unknowable" mantra, and it has continued in the Open era.

Also, we still see pure conditioning movements like running and rowing quite a bit at the Games, but they don't often take up as much of the scoring as in the early days. Even this year with 2 exclusively rowing events and another event featuring rowing, that still only made up less than 20% of the total points; in 2007 and 2008 combined, running made up 28% of the scoring (2 of 7 events).

In addition to looking at these broad categories, let's take a look at which individual movements have historically been the most common, and which are the most common in this era. Below is a chart showing the top 10 movements** across all 7 years of competition (Games only) and the top 10 movements in the past 3 years (Games only). Note that in calculating the utilization across different years, I looked at how much each event counted towards the total scoring in that year. So the one running event in 2007 was 33%, which would be equal to 4 events in the 2013 Games.


Note that running is still a very key components of the Games (and rightfully so), which makes it all the more disappointing that running is hardly used at all at the Regional or Open level. What we see in recent years, though, is that if you want to win the CrossFit Games, you must have a big clean and snatch, be able to crush muscle-ups and climb a rope with ease. Being able to deadlift 600 pounds or hit 35 rounds of Cindy may not do you as much good as it used to, at least not once you reach the CrossFit Games. Interesting, too, that swimming and biking are among the top 10 movements in the past three years - yet to reach the Games, you likely don't need to be able to do either of them.

So where are we headed? It's hard to tell. For one, the Games are programmed by a small group of people; the events that are programmed are not naturally occurring phenomena, so trying to make bold predictions based on the current direction of trends doesn't work quite as well as we'd like. For all I know, Dave Castro could read this and decide to move things in the exact opposite direction.

We do know the Games are getting bigger, the athletes are getting better and the challenges likely won't get any easier. We do know if you want to win the Games, you need to be able to lift heavy weights, move quickly and maintain intensity over a long period of time. Beyond that, it's a bit unknown, and to some extent, unknowable.


Note: Some of these charts have been updated on September 28, two days after this article was posted originally. The changes were not major, and the biggest changes were to the list of top 10 movements all-time.

* - In 2007, I limited my averages to the top 20 men and top 10 women, because things fell off really quickly after that. Remember, there was no qualifying stage and only 39 people did all 3 events without scaling. In 2008, I limited my averages to those that did not scale any events.
** - The 2010 "Sandbag Move" event was grouped as a sandbag run (i.e., the same as the 2009 "Sandbag Run") in this analysis.

Movements Subcategories (note that some of these, like bench press, have never occurred in a CFHQ competition, but I have encountered them in other analyses I've done):

Wednesday, August 14, 2013

A Closer Look at the 2013 Games Season Programming

I struggled for the last few days on how to present this analysis. Last year, I wrote two lengthy posts assessing the programming for the 2012 Games season. I titled the posts "Were the Games Well-Programmed." While I thought those posts turned out well, I hesitated to simply follow the same template as last year, for a couple reasons:
  • Plenty of people have an opinion on the Games programming, many of whom are much more known in the CrossFit community than me (for instance, I've already read analysis from Rudy Nielsen and Ben Bergeron). Do we need more opinions out there?
  • Assigning grades or giving a thumbs-up/thumbs-down to the Games programming gives off the impression that I have it all figured out. I think HQ has made it clear that they work very hard not to be influenced by the outside world in their decision-making. Am I really going to accomplish anything by telling them they were wrong?
However, balancing those concerns was my feeling that I do have something unique to provide to the discussions. And, most importantly, I think the discussion is important. While I respect HQ's stance to do things their own way, I'd like to think that they are always looking for ways to improve the Games. Although I don't work for HQ, I don't feel as though I'm an outsider. Those of us in the community, and especially those who've been following and competing in the sport for years, are all working toward the same goal: to keep this sport progressing in the right direction. I know that HQ is at least marginally aware of this site, considering Tony Budding took the time to comment on my scoring system post last year. Here's to hoping they're still keeping up with me (and I promise I'll leave the scoring system out of the debate for now, Tony).

With that in mind, this post will be broken down in much the same way as last year's discussion. There are five goals I think that should be driving the programming of the Games, in order of importance:
  1. Ensure that the fittest athletes win the overall championship
  2. Make the competition as fair as possible for all athletes involved
  3. Test events across broad time and modal domains (i.e., stay in keeping with CrossFit's general definition of fitness)
  4. Balance the time and modal domains so that no elements are weighted too heavily
  5. Make the event enjoyable for the spectators
What I'd like to do is assess how well those five goals were accomplished this season. Unlike last year, however, I'm making a couple changes.
  • This year, I'm going to take the entire season into account in this post (last year I separated the Games programming specifically from the Games season as a whole). I've already covered the 2013 Open and Regional programming to some degree in previous posts, so I'll be incorporating some of that here. I think it's better to try to view the Games in the context of the whole season.
  • I won't be giving grades for each goal this year. Instead, I'll be pointing out suggestions for improvement, because simply identifying the problems only gets us halfway there. Additionally, I'll point out things that I felt worked out particularly well. Every year, HQ does a few things that bug me, but they also do a handful of things that make me say, "Hey, that was a great idea. I wouldn't have thought of that." I think it's worth acknowledging both sides.
So with that as our background, let's get started.

1. Ensure that the fittest athletes win the overall championship

I think it's hard to argue this wasn't accomplished this year. Rich Froning was challenged, but he still came out of the weekend looking pretty unbeatable. Sam Briggs, although she did show a few weaknesses, appeared to be the most-well rounded athlete across the board by the end of the weekend, while many of the women who were expected to be her top competition had major hiccups. Both Froning and Briggs won the Open and finished near or at the top in the cross-Regional comparison.

Additionally, as I pointed out in my last post, the athletes that we expected to be at the top generally finished that way. That doesn't absolutely mean that the Games are a perfect test, but it does provide some validation when the top athletes keep showing up near the top across a variety of tests in successive years.

How We Can Do Better: I don't really have anything here. The right athletes won, so mission accomplished.
Credit Where Credit is Due: The fact that almost all the athletes competed in every event really helped keep things interesting until the end. In the past, we've seen athletes build an early lead and hang on simply because the field gets so small that there aren't enough points to be lost in the late events. Allowing 30 athletes to finish the weekend allowed some big swings at the end, including Lindsey Valenzuela's move from 5th to 2nd in the final two events.


2. Make the competition as fair as possible for all athletes involved

Because I promised Tony Budding I wouldn't bring up the scoring system in general, I won't touch on that here. Let's just say I think the scoring system is fair enough. However, the way the scoring system was applied in Cinco 1 and 2 didn't make a whole lot of sense. Any athlete who didn't finish the handstand walk (Cinco 1) or the lunges (Cinco 2) was locked in a tie, despite the fact that the lunges took 2-4 minutes and the separation was very clear between many athletes who were tied. Because of the massive logjam (21 male athletes tied for 7th, 13 female athletes tied for 4th), the few athletes who did finish didn't get that big of a point spread on many other athletes who were on pace to be several minutes behind.

The other issue here is judging, which does tie in with programming to some extent. I think the judging continues to improve each year. Anyone who's been to a local competition has seen the judges who just don't have the stones to call a no-rep. That simply doesn't happen at the Games. You cannot get away with cheating reps, and that's definitely a good thing for the sport.

I won't dwell on it here, but everyone knows the judging in the Open is still a concern (see 13.2 Josh Golden/Danielle Sidell fiasco this year). Hopefully some careful programming will alleviate that next year.

How We Can Do BetterImprove tiebreakers for movements such as walking lunges, handstand walks, running, or anything where a distance is involved instead of a number of reps. Also, I'd prefer to have Games athletes not perform chin-to-bar pull-ups. They are really tricky to judge and aren't as impressive to spectators. In fact, the whole "2007" event just didn't really work for me; it seemed like basically a pull-up contest for the athletes at this level.
Credit Where Credit is Due: Chip timing helped identify the winners really nicely in some of the shorter events. Also, judging keeps improving each year.


3. Test events across broad time and modal domains (i.e., stay in keeping with CrossFit's general definition of fitness)

Right off the bat, let's look at a list of all the movements used this season, along with the movement subcategory I've placed each one into. I realize the subcategories are subjective, and an argument could be made to shift a few movements around or create a new subcategory. In general, I think this is a decent organizational scheme (and I've used it in the past), but I'm open to suggestions.


It's pretty clear that the CrossFit Games season is testing a very wide variety of movements, and the majority of those were used in the Games. Even some that were left out of the Games, like ordinary burpees* and unweighted pistols, were used in other forms (wall burpees*, weighted pistol). No major movements that we've seen in the past were left out of this entire season, with the exception of back squats. I've seen some suggestions online about testing a max back or front squat in the future, as opposed to the Olympic lifts that we have been seeing a lot.

Another key goal is to hit a wide variety of time domains and weight loads. Below are charts showing the distribution of the times and the relative weight loads (for men) this season. The explanation behind the relative weight loads can be found in my post "What to Expect From the 2013 Open and Beyond." Two notes: 1) some of the Regional and Games movements had to be estimated because I don't have any data on them (such as weighted overhead lunge and pig flips); 2) the time domains for workouts that weren't AMRAP were rough estimates of the average finishing times.


Although most of the times were under 30 minutes, we did see a couple beyond that, including one over an hour (the half-marathon row). As for the weight loads, we saw quite a range as well. The two heaviest loads were from the max effort lifts (3RM OHS and the C&J Ladder), but there were also some very heavy lifts used in metcons, mainly in the Games (405-lb. deadlifts for crying out loud). Still, lighter loads were tested frequently in early stages of competition (Jackie, 13.2, 13.3).

How We Can Do BetterI like the idea of testing a max effort on something other than an Olympic lift.
Credit Where Credit is Due: Nice distribution of time domains, and no areas of fitness were left neglected entirely. CrossFit haters can't point to many things and say 'But I bet those guys can't do X.' Yeah, they probably can.


4. Balance the time and modal domains so that no elements are weighted too heavily

Based on the subcategories of movements I've defined above, let's look at a the breakdown of movements in each segment of the 2013 Games Season. These percentages are based on the weight each movement was given in each workout, not simply the number of times the movement occurred (for example, the chest-to-bar pull-ups were worth 0.50 events in Open 13.5, but they were worth only 0.25 events in Regional Event 4).


One thing that surprised me was how little focus there was at the Games on basic gymnastics (pull-ups, push-ups, toes-to-bar, etc.). However, there was quite a bit of bodyweight emphasis (high-skill gymnastics like muscle-ups and HSPU), as well as some twists on other bodyweight movements (wall burpee, weighted GHD sit-up). Overall, bodyweight movements (including rowing) were worth 60% of the points and lifts were worth 40%.

Another surprising thing was how much emphasis there was on the pure conditioning movements like rowing and running. Now, one of the "running" events was the zig-zag sprint, which wasn't actually about conditioning but rather explosive speed and agility. Still, the burden run and the two rowing events really put a big focus on metabolic engine and stamina. I have no problem with this, but what I would like to see is these areas tested more early on. Running in the Open is almost impossible, but at the Regional level, it would make sense to test some sort of middle- or long-distance runs so that athletes who struggle there would have those weaknesses exposed.

As far as loading is concerned, what seems to be happening at the Games in recent years is that things are either super-heavy or super-light. Only two of 12 events tested what I would consider medium loads (somewhere around a 1.0 relative weight for men, like 135-lb. cleans or 95-lb. thrusters), and none tested light loads. Also, as noted above, the bodyweight movements that were required were generally extremely challenging. I personally wouldn't mind seeing some more "classic" CrossFit workouts involved, like we saw with "The Girls" at the end of last year's Games.

Whereas last year's Games seemed to be lacking in the moderately long time frame (12:00-25:00), I think they did a better job of spreading things out this season. In the Games, we had 1 event over 40:00, 3 between 12:00 and 40:00, 4 between 1:00 and 15:00 and 2 that were essentially 0 time.

One other way to see if we're not weighting one area too much is to look at the rank correlations between the events. If the rankings for two separate events are highly correlated, it indicates that we may be over-emphasizing one particular area. For this analysis, I focused only on the Games, because it's not really such a bad thing if we test the same thing in two different competitions since the scoring resets each time, but within the same competition, it's more of a problem. 

I looked at the 10 Games events in which all athletes competed, which gave me a total of 45 unique combinations for men and 45 combinations for women. Of those combinations, only 8 had correlations greater than 50% and only 3 had correlations greater than 70%. Not surprisingly, the 2K row and the half-marathon row were highly correlated for both men and women (54% for men and 81% for women). Also, the Sprint Chipper and the C&J Ladder were strongly correlated (70% for men and 54% for women), likely because they both had a major emphasis on heavy Olympic lifting. One surprise was that the burden run and the 2K row were 79% correlated for women, but I think that may have been somewhat of a fluke, considering the correlation was just 31% for men.

In the end, most events appeared to test pretty distinct aspects of fitness, which is a good sign.

How We Can Do Better: Fans love the heavy movements, but I'd suggest supplementing those with some more moderate weights as well. CrossFitters can relate to someone crushing a workout even if the weight it not enormous (those Open WOD demos weren't bad to watch, were they?) Also, let's test running earlier in the season.
Credit Where Credit is Due: We saw events where even Rich Froning and Sam Briggs found themselves near the bottom, which tells me we are really testing a wide range of skills. And actually, I liked limiting the Games to 12 events (instead of 15 last year), because in my opinion that was sufficient and we didn't wind up double-counting too many areas.


5. Make the event enjoyable for the spectators

Unfortunately I don't have any data to back this up, but in my opinion, this is the area that I think has improved the most in recent years. I think a nice touch at the Games is that in multi-round workouts, each round is performed at a different point on the stage. This really helps the audience follow the action and builds the drama as you see athletes progress through the workout.

Making all the events watchable was also nice after Pendleton 1, Pendleton 2 and the Obstacle Course were unavailable last season. The burden run had many of the same qualities as an off-road event, but it was all done on site and finished up in the soccer stadium.

However, as nice as it is to use the soccer stadium to allow more spectators, the vibe at those events is considerably more subdued. Perhaps HQ will be able to find a way to improve this in the future, but it seems that this sport isn't quite as conducive to viewing from such a distance. By contrast, the intensity in the night events in the tennis stadium is fantastic.

How We Can Do Better: Figure out a way to make things a bit more exciting in the stadium. It won't be easy, but there's no denying that things weren't quite as intense when the workouts were held there.
Credit Where Credit is Due: The Games are truly becoming more of a spectator sport. Even the uninitiated can see the action unfold and understand and appreciate what's going on. And although I mentioned it above, the improvements in judging have helped the spectator experience.


*I decided to break up "wall burpees" into burpees and wall climb-overs. Each were worth 1/6 of the value of that workout (snatch was 1/3 and weighted GHD sit-up was 1/3). This was updated on 8/22/2013.

Thursday, August 1, 2013

Quick Hits: Initial Games Reaction and Upcoming Schedule

Does anyone else go through a weird sense of withdrawal after the Games ends each year? After spending all spring analyzing the Open and Regionals, making predictions and finally attending the Games in person, it's bizarre to consider that we won't really start up another season for six more months. Sure, there will be follow-up videos posted on the Games site for the next few weeks, but eventually the coverage will dry up and we'll all be back in the grind of preparing for next season.

Hopefully, I can fill that void to a certain extent. My goal over the next few months is to break down the 2013 Games and Games season in depth, take a look back at the history and evolution of the Games from a statistical perspective, as well as delve into a few new topics related to training, programming and competition. First on the slate is a critical look at this year's Games, similar to what I did last year in my post "Were the Games Well-Programmed? (Part 1)." My goal is to put this together in the next week or two.

For today, I just wanted to get some quick reaction to the Games out there:

  • The thing that stuck out to me attending the Games in person the past two years is how well-organized and professional the whole event is. Considering this thing is just four years removed from being held on a ranch, it's amazing to see how efficiently things run today. Virtually every event got off on time, the judging was solid, there were no equipment problems, and from what I could tell, the televised product looked good as well. The ESPN2 broadcast certainly seemed to go over well.
  • It's also a blast being out there in person, and I'd recommend it to anyone who hasn't been. Sure, it can be a little draining to sit outside for 10-12 hours a day, but there is plenty to do outside of just watching the events, such as the vendor area, the workout demos, a wide food selection and of course some general people-watching. Many of the CrossFit "celebrities" we see on videos online all the time (plus more mainstream fitness celebrities like Bob Harper) are just hanging out in the crowd like everyone else.
  • As for the competition itself, I think we crowned the two deserving champions. 
    • Rich Froning proved again that he's simply the most well-rounded CrossFitter out there, and as usual, he seems to get better as the stage gets bigger. I'm starting to get the sense that he really looks at the big picture and maybe, just maybe, holds a little bit back early on to keep his body intact until the end. Remember, he didn't win any events until Sunday, where he won all three.
    • Sam Briggs was also the most well-rounded athlete, but she did have a few holes exposed. The zig-zag sprint and the clean and jerk ladder both made her look vulnerable, but she was so solid on the metcons that it didn't matter. I think if Annie Thorisdottir can return at full strength next year, it will be a real battle between those two. Annie clearly has a big strength edge, but I don't think she is at quite the same level as far as conditioning.
  • In my opinion, which I'll expand on in my next post, the test was probably the best all-around that we've had to date. It wasn't too grueling to the point where athletes were falling apart by the end of the weekend, but it was a legitimately challenging weekend. The events were nicely varied, and there were only one or two duds from a spectator perspective.
  • Although things got shaken up at first, the cream really rose to the top by the end of the weekend, particularly for the men. 
    • For the men, I had Froning at a 59% chance to win coming in, and all the men on the podium had at least a 34% chance of doing so according to my predictions. Of the top 10 finishers, 7 were in my top 10 coming in. Garrett Fisher (5th) was probably the biggest surprise on the men's side.
    • For the women, I had Sam Briggs as the favorite at 32% coming in, and I had Lindsey Valenzuela with 15% chance of reaching the podium. Valerie Voboril was a bit more of a surprise, but I still had her with an 8% chance of reaching the podium. Of the top 10 finishers, 4 were in my top 10 and 9 were in the top 21. The only big surprises near the top, based on the Open and Regionals, was Anna Tunnicliffe. I was, however, surprised that Camille Leblanc-Bazinet (16th) and Elizabeth Akinwale (10th) didn't finish higher.
That's it for now. I'll be back in a week or two with a more in-depth breakdown of this year's Games. Until then, good luck with your training!

Friday, July 26, 2013

After Day 1, Is Rich Froning Still The Favorite?

Anyone who has been following the CrossFit Games for the past few years probably knows that the results after the first couple events generally don't really look a whole lot like the results at the end of the weekend. For one, there are simply a lot of events left to shake things up. This year, it appears we have at least 8 left, but I'm guessing more. But also, the early events have typically involved some atypical CrossFit movements, particularly swimming. The best swimmers have had a big advantage in the early events in the past few years, but the best swimmers aren't necessarily the best CrossFitters, so they often fall off over the course of the weekend.

Still, if you're making predictions right now (and you can make them up until the first Friday event, in fact, at the contest at switchcrossfit.com), you can't simply ignore the results from Wednesday. Those points are in the bank, and guys like Dan Bailey (currently 34th) now have a lot of ground to make up if they want to make it back into contention. My stochastic projections prior to the Games had Bailey picked very high, but how high would I pick him right now? And what about Rich Froning, who was a heavy favorite coming in but is currently in 6th?

Well, I took a couple hours to look into this. What I did was pretty simple: I re-ran my stochastic projections, but I replaced three of the random events with the actual results from Wednesday. The events I replaced were the random event based on last year's "long event" and 2 events based on this year's Regionals. My model still assumes 15 scored events, so we have 10 left that are based on this year's Regionals and 2 left that are based on this year's Open. If we assumed this year will have fewer than 15 events, the results would a little bit different - the current leaders would have a bigger advantage. But I think there are still a lot of points left on the table.

To keep things short, I'm not going to reproduce the entire table here for men and women. Rather, I'll give a quick recap of the current favorites, as well as some of the biggest movers after day 1.

Men
Favorite: Rich Froning, 51% chance. Froning dropped from a 58% chance prior to the Games but still is close enough to be considered the favorite in the long run.
Biggest contender: Jason Khalipa, 34% chance. Khalipa was already in the discussion, but his dominant performance on day 1 moved him up from a 7% chance coming in.
Others still with a strong shot: Scott Panchik, 7%; Josh Bridges, 5%. Both lost some ground on the rowing events. For those who read my methodology, you'll recall Panchik and Bridges were expected to do well on day 1 because of strong showings on the long events in past years.
Other notes: Dan Bailey dropped from a 1.7% shot to an 0.6% shot after a rough day 1, and Ben Smith fell from 3.6% chance to a 1.0% chance. Even the guys like Garrett Fisher, Chad Mackay and Justin Allen who did really well on day 1 are still pretty big longshots based on their Regional performances. The fact that the leader is Jason Khalipa doesn't make it any easier for them to make up ground. However, I do now have Fisher (currently 2nd overall) with a 7% chance at the podium, up from 1% coming in.

Women
Favorite: Sam Briggs, 66% chance. She was the favorite coming in at 32%, and with a lead, she's got to be an even bigger favorite. She doesn't have a lot of holes in her game, but there are still a lot of unknown events that could shake things up.
Biggest contender: Lindsey Valenzuela, 8% chance. She had a strong day 1 and is always a threat to win some of the heavier events. She moved up from about a 5% shot coming into the Games.
Others still with a strong shot: Kaleena Ladeirous, 6%; Rebecca Voigt, 7%; Elizabeth Akinwale, 4%; Talayna Fortunato, 3%. Ladeirous and Fortunato moved into the mix with good showings on day 1. Akinwale was a big contender coming in but now has a good deal of ground to make up sitting in 20th.
Other notes: Camille Leblanc-Bazinet dropped from a 9% chance to just a 2% chance now that she's back in 28th. There are three other athletes still with at least a 1% chance: Michelle Letendre (2.4%), Alessandra Pichelli (2.3%) and Kara Webb (2.0%). Rory Zambard, relatively unknown coming in, is at a 0.3% chance of claiming the title, after a very solid day 1.

It's still early, and the key for the top athletes is just to keep themselves within striking distance. Nobody is truly out of it at this stage, but a few athletes certainly made things a bit harder on themselves, while others gave themselves a real shot.

I'll be in California watching the Games in person for the next few days, and I don't plan to post anything else until I get back into town next week. Until then, enjoy the Games everyone!

Monday, July 15, 2013

So Who CAN Win the 2013 CrossFit Games - Predictions

Just a few quick notes before getting to the picks:
  • These picks are based almost entirely off the results from this season, and thus the order will be similar (but not identical) to the Cross Regional Comparison found at http://crossfitregionalshowdown.com/leaderboard/men.
  • There are some Games veterans, like Matt Chan for instance, whose odds probably look lower than some would expect. That's because last year's Games played only a very minor role in these projections. Although there are some athletes for whom we could probably make an exception, I think that in general, the results from Regionals this season are the best predictors of what will happen at the Games this season. Regionals are competitive enough now that I doubt many athletes were holding much back.
  • For full methodology, see the previous post. The general idea is to use the results from the events that have occurred this season and simulate Games events that would be similar to them.
  • These are rounded to the nearest 1%, so some athletes listed with a 0% chance actually may have non-zero chance according to the model, but that chance is less than 0.5%. For instance, virtually everyone had a non-zero chance of finishing in the top 10. The list is sorted by chance of winning, prior to rounding, and in case of ties, it is sorted by average finish.
  • This is all in good fun, so don't take it too seriously if your favorite athlete doesn't appear as highly as you'd like. I'm well aware that this model isn't perfect, but my goal is to make the best predictions I can with the data we have available. There's plenty going on behind the scenes for each of these athletes and plenty of other variables that I simply can't capture.
  • I'm curious to hear who you guys are picking this year. I think it should be a blast to see how things play out given the level of competition we've already seen this season. Post to comments or shoot me an email to let me know your take.
OK, without further ado, here are the picks. For each athlete, I have the estimated chance of him/her winning, placing in the top 3 (podium) and placing in the top 10 (money), along with the average ranking he/she attained across all simulations.


So Who CAN Win the 2013 CrossFit Games - Methodology

In some ways, it seems like making predictions about the CrossFit Games should be relatively easy. After all, we have plenty of data to make direct comparisons between athletes. So far this season, these athletes all have completed the same 13 events. By this point, it seems like the cream should have risen to the top. Remember, the 2007 Games had only three events and the 2008 Games had only 4 events. With 13 events already, shouldn't the champion be fairly clear?

Of course, what we've seen is that competition has gotten much tighter in recent years. In 2008, there were only a handful of athletes of the caliber to even think about contending for the title. This year, if we compare the Games athletes, 14 different male athletes and 14 different female athletes have finished in the top 3 of at least one workout. So nearly a third of the field has shown the capability to be the close to the best in the world on a given workout.

So, obviously, the complicating factor with predicting the Games is that we don't know what the workouts will be. And even if we knew what they were (in fact, we likely will know some of the events within the next week or so), we can pretty much guarantee that they won't match any of the 13 workouts we've seen thus far. So what can we do?

Last year, I estimated the odds of each athlete winning the Games by randomly selecting 10 events from among the Regional and Open events that had occurred. As I looked back on that methodology, I noticed that it really only gave a small number of athletes a chance at winning or even placing in the top 3. The reason is that I implicitly assumed that each event of the Games would exactly mirror one of the prior events of the season. After some investigation, it turned out that most of the events from the Games did not match any one event from the Regionals or Open particularly closely.
  • Of the 20 events from the 2012 Games prior to cuts (10 men's events + 10 women's events), I looked at the correlation between that event and each Regional and Open event.
  • For each of those Games events, I took the maximum of those correlations.
  • 3 of 20 were at least 60% correlated with one Regional or Open event.
  • 10 of 20 were at least 50% correlated with one Regional or Open event.
  • 5 of 20 were not more than 30% correlated with any Regional or Open event.
Certainly, the reason for this variation is due largely to the design of the workouts in the Games vs. the Regionals and the Open. But I also think part of it is due to the fact that the Games are simply a different competition than the Regionals and the Open. Athletes come in at varying levels of health, with varying levels of nerves, and so even if the events were identical to regionals, I think we'd have different results.

Either way, I felt that in estimating the chances for each athlete this year, I needed to account for how much variation we have seen from the Regionals/Open to the Games. I needed to simulate the Games using results that weren't identical to the Regionals/Open but were correlated. I also wanted to rely primarily on the Regional results, since we know that some top athletes tend to coast through the Open while others take it a bit more seriously. Still, I did include the Open results to a lesser extent, because I don't think it's fair to ignore it entirely as it provides insight into how athletes fare in events that are generally lighter than what we see at the Regional level.

Additionally, we know that historically, the Games has typically included at least one extremely long event (Pendleton 2, for instance). This event is generally very loosely correlated with anything at Regionals or in the Open. But, we can assume that athletes who did well on the "long" event the prior year will likely do well on the long event this year this year.

So I set up a simulation of 15 events, assuming no cuts (all athletes compete in all 15 events). Here is a description of how each event was simulated:
  • For 12 events, I randomly chose one of the Regional events to be the "base" event.
  • I started with the results (not the placement, the actual score) from that base event, then "shook up" those results enough so we'd get about new rankings that were roughly 50% correlated to the base event.
    • To "shake up" the original results, I adjusted each athlete's original result randomly up or down. Exactly how much I allowed the result to vary depended on how much variation was involved in that event to begin with. So if Regional Event 4 was the base event, I might let the scores vary by 3 minutes, but if Regional Event 1 was the base event, they might vary by only 1 minute.
    • I did testing in advance to see how much I needed to vary each individual's score to achieve about 50% correlation. It turned out to be about +/- 2.5 standard deviations. So each athlete's score could move from his/her original score by as much as 3 standard deviations in each direction.
    • The athletes scoring well in the base event still have an advantage, but we allow things to shift around a bit.
  • For 2 events, I used the same process, but I randomly chose one of the Open events to be the "base" event.
  • For 1 event, I used the Pendleton 2 results from 2012 as the "base" event. For athletes who didn't compete in the Games last year, they were assigned a totally random result.
    • Athletes who did well last year have an advantage, but I did "shake up" the results a bit in each simulation.
    • Keep in mind that finishing poorly in Pendleton 2 last year was considered worse than not competing at all.
    • I made two exceptions: Josh Bridges and Sam Briggs missed last year due to an injury but did extremely well on the long beach event in 2011. I treated them as if they had competed in Pendleton 2 and finished very highly.
  • These events were simulated 5,000 times. The Games Scoring table was applied to determine the final rankings after each simulation.
Before applying this method to this year's field, I went back to see what type of estimates I would have gotten last year with this method. Some notes from those simulations:
  • I looked at how good a job I did at predicting which athletes would finish in the top 10. The mean square error (MSE) of my model would have been 0.121 for women and 0.104 for men. Had I simply assumed the top 10 from Regionals would be top 10 at the Games with 100% probability, the MSE would have been 0.130 for men and 0.133 for women. If I had instead assumed all athletes had an equal shot at finishing in the top 10, the MSE would have been 0.254 for men and 0.259 for women. So I did have an improvement over those naive estimates.
  • On the men's side, I would have given Rich Froning a 45% chance of winning, with Dan Bailey having the next-best chance at 30%. For the women, I would have given Julie Foucher a 53% chance of winning and Annie Thorisdottir a 22% chance of winning (remember, Foucher was the pick for many in the community last year, including me). No one else would have had more than a 7% chance on the women's side.
  • For podium spots, I would have given Froning an 86% chance, Chan a 4% chance and Kasperbauer a 2% chance. For women, I would have given Thorisdottir a 61% chance, Foucher an 84% chance and Fortunato a 3% chance. While it would be nice to have given Chan, Kasperbauer and Fortunato a better shot, I don't recall many people talking these athletes up prior to the Games. None had ever reached the podium before, although Chan had been close.
My goal was to strike a balance between confidence in the favorites (like Froning) and allowing enough variation so that relative unknowns (like Fortunato) still have a shot. This largely comes down to how much I shook up those original results. The less I shook up the original results, the more confident I would have been that Froning would have won last year. But I also would have given someone like Matt Chan virtually no shot, because his Regional performance simply wasn't that strong compared to the other heavy hitters. But if I shook up the original results too much, things just got muddy and I allowed everyone to have a fairly even chance to win, which doesn't seem realistic either.

No model is going to be perfect with this many unknowns. Sure, you could argue that I am not taking into account other factors, like the advantage that Games "veterans" could have. But I would counter by pointing out that last year, Fortunato was a first-time competitor and Kasperbauer hadn't competed individually since 2009, and they both fared well. Other athletes like Neil Maddox simply didn't perform well at the Games despite experience at the Games and great performances at Regionals. A lot of it simply has to do with what comes out of the hopper, how each athlete manages the pressure and what little breaks go for or against each athlete throughout the course of the weekend. But at the end of the day, the fact is that the athletes who do well at Regionals and the Open generally fare well at the Games, and that's why I am using those results as the basis for my estimates.

With the methodology and assumptions out of the way, move ahead to my next post for the picks for the 2013 Games!


Thursday, July 11, 2013

Quick Update - Predictions Coming Soon

Hello all. I just wanted to drop a quick post to say that it's been a busy week, but my predictions for the Games will be forthcoming soon, likely this weekend. I'll be estimating the likelihood of each individual athlete winning the whole thing, placing in the top 3 and placing in the money (top 10). The process is a bit more complex than last year, but I think it should be pretty neat.

I'm also curious to see what you guys are thinking about this year's Games. Seems pretty clear that Froning will be the favorite on the men's side, but the women's side is wide open. Feel free to post thoughts to comments here or on my next post, after I make my predictions.

The Games are coming up on us soon (potentially under 2 weeks, depending on when the competition actually starts), and I'm pumped to get out to L.A. to watch. In the meantime, good luck with your training!

Sunday, June 30, 2013

Which Have Been the "Best" Events This Season?

If you've been reading my blog for any length of time, you know that one of the ways I like to evaluate the effectiveness* of a CrossFit event is by looking at how well the results from that event correlate to results from a variety of other events. I laid out the theory behind this in my post from last year titled "Are certain events 'better' than others?", but I'll recap it here:
  • In a competition setting, what we are trying to do is learn as much about each athlete's overall fitness level as possible.
  • We only have a limited number of events to do this, particularly in the Open and at Regionals. Therefore, we need to maximize the information we get from each event.
  • If athletes who score well on a particular event tend to score well across the board, then that event is probably a good indicator of overall fitness. Conversely, if the results from that event don't correlate at all with results in other events, then maybe that particular event did not really tell us much.
Overall, this year's regionals and Open were set up well for me to do this type of analysis. I did this same analysis after last year's regionals, but due to the cuts after regional event 5, I was left with only about 250-300 athletes of each gender who completed all the Open and Regional workouts, and this limited the analysis to only the very elite athletes. I also did this analysis after the Open this year, which gave me a huge sample of athletes, but with only 5 events, I didn't really have a "wide variety" of events to evaluate. 

This year, because we did not have any cuts at Regionals, I was left with 673 men and 512 women who have completed all 12 events this season. Although these are all still very solid athletes, I got a lot more of the borderline regional competitors in the mix than I did last year. Remember, a "good" event for the Games might not make a "good" event for a competition within your own box. So keep in mind with this analysis that we are evaluating these events based on how well they predict overall fitness for Regional competitors.

The methodology for performing this analysis this year was the following:
  • For athletes who completed all events this year, compile their results (not just their ranking) for each of those events. The Regionals results I used are those that have been adjusted to account for the week in which week each athlete competed. See my previous post for more info on those adjustments.
  • Rerank the entire field in each of those events.
  • For each event, calculate the sum of each athlete's ranks in all other events.
  • Calculate the Pearson correlation (referred to from here on out as simply "correlation") between the ranks in each event and the sum of ranks in all other events. Higher correlations indicate "better" events.
Below are the results for both men and women.


The pattern that emerges is one I've noticed pretty much across the board since I've been doing this type of analysis: events with more movements tend to be better tests of fitness. This makes sense intuitively, since they test more things, by definition. That doesn't mean we shouldn't have single-modality events in competition, it just means they probably should be used sparingly and only for movements that are deemed very important.

You may notice that Open Event 2, which had three movements, is bucking this trend by falling quite close to the bottom. The concerns with this event were pretty well documented during the Open: judging was very difficult, the weights were extremely light for top competitors, and the option of step-ups was utilized by a lot more athletes than was probably expected. So simply because you have 3 or 4 movements in an event doesn't make it a great one.

To get a visual interpretation of the concept I'm getting at here, below are scatter plots for some of the best and worst events from this year. On each graph, the x-axis represents each athlete's rank on that event and the y-axis represents each athlete's combined rank on all other events.


It should be fairly clear that for the first two graphs, there is a clear relationship between the x- and y-axis. Athletes who did well on these events generally did well across the board. On the third graph, the points are much more scattered, indicating that there were plenty of athletes who did well on Open Event 2 who didn't fare well across the board, and vice versa.

Although I consider the results using the entire Regional field to be the most useful, I also tested performed this analysis on three other subsets of the regional field:
  1. Games athletes only
  2. Top 292 men and top 258 women (same number as I had in my analysis last year)
  3. Random sample of 20% of the entire regional field

What I was interested in was how volatile my results were. For instance, is Regional Event 1 really better than Regional Event 4 for women (76% vs. 74%)? Would that hold up if I changed the group of athletes a bit?

In general, the events near the very top and the very bottom stayed in that vicinity, with a couple of exceptions. Here are the main takeaways:
  • For men, Regional Event 4 was in the top 3 across all the samples and Open Event 1 was in the top 5 across all the samples. For women, Regional Event 4 was in the top 4 across all the samples, Regional Event 1 was in the top 5 across all the samples, Open Event 1 was in the top 5 across all the samples and Open Event 4 was also in the top 6 across all the samples.
  • Considering HQ is programming the same events for both men and women, I would conclude that Regional Event 4 ("The 100s") and Open Event 1 (AMRAP 17 of burpees and snatch) were the best events this season. In one of my 2013 Open recap posts, I noted that 13.4 was generally the best event of the Open. I still feel that it was a very good event for the entire Open field, but it wasn't quite as strong when we look at just these stronger athletes. 
  • Across both men and women, Open Event 2, Regional Event 5 and Regional Event 3 were each in the bottom 4 in all but one sample. I would conclude that these were generally the three weakest events this season. 
    • I mentioned some issues with Open Event 2 above.
    • For Regional Event 5, I think the issue is that we saw a lot of athletes near the bottom of the field do well on this simply because they could deadlift a house. If you could handle the deadlifts easily, you could generally do well even if you weren't particularly great at box jumps or had sub-par aerobic capacity.
    • For Regional Event 3, I think the issue was that the burpees did not really factor into this much, making it basically just a muscle-up test. As far as single-modalities go, this wasn't too bad of an event. But personally, I think this event and the overhead squat ladder (a true single-modality) should have been worth only 50% of the other events.  
  • Two of the events featuring box jumps turned out to be relatively modest tests of fitness. Throw in all the complaints about achilles problems we've seen popping up recently, and I think HQ may want to look into adjusting how they program box jumps. I think box jumps are a good test of fitness in general, but I'd personally love to see us go to box jump-overs (onto and over the box with an option to jump straight over) in the future.
  • With the exception of Open Event 2 and Regional Event 5, I think the rest of the events were generally solid. As I mentioned above, I might consider adjusting the point value for a couple of the other ones.

I also did one final analysis, primarily out of curiosity. Using the entire Regional field, I looked at the correlation between each pair of events. Some of the interesting findings:
  • In general, the most highly correlated pair was Regional Event 4/Regional Event 1 (71% for women and 67% for men). This is somewhat surprising given how the time domains were completely different, but both involved pull-ups and a light thruster-type movement (bar thrusters or wall-balls).
  • The two muscle-up workouts (Regional Event 3 and Open Event 3) were highly correlated (68% for women and 55% for men).
  • Regional Event 5 and Regional Event 7 were highly correlated (56% for women and 68% for men). Both were extremely heavy.
  • The least-correlated pair was Regional Event 3/Regional Event 5 (17% for women and 19% for men). Shouldn't be a surprise considering one was bodyweight only and one involved extremely heavy deadlifts. The pair of Regional Event 2/Regional Event 3 were also not very correlated (38% for women and 22% for men). Remember those occurred within 2 minutes of each other.
That's about it for today. This is always one of my favorite analyses to work on, but with the Games fast approaching, I suppose it's about time to start tackling the tough questions and making some predictions. Will Froning three-peat? (Probably) Who will emerge on the women's side with Annie out? (It's wide-open) Will the first event of the Games take more or less than 4 hours? (God, I hope so) What bizarre contraption will Rogue unveil this year? (Potentially a flying bicycle, similar to the one in E.T.) Who will wear the shortest shorts this season? (Stacie Tovar still the champ until proven otherwise)

Anyway, until next time, good luck with your training!


*I am referring to the effectiveness of this event as it relates to competition. In other words, is this event a good test of fitness. This does not necessarily mean the event is good or bad for training purposes. For instance, I feel that 13.2 was not a good workout for testing (due to a lot of factors, like how difficult it was to judge and how light it was for the top competitors), but in training, I think it would be a good workout for building aerobic capacity (and it definitely left me hurting).