But the natural follow-up question is this: If performing well in the Open is our goal, should our training look like the Open as well? If performing well at Regionals is our goal, should our training look like what we'll see at Regionals?
I'm going to try and approach this in two parts. First, I want to look at this from a mathematical, somewhat theoretical perspective to see what we can learn that way. Next, I want to examine some popular and successful training regimens and see how they compare to the Open, Regionals and Games.
Part 1: A Theoretical Perspective
(If you absolutely hate algebra, I apologize in advance. This section contains some, but there's pretty much no way to understand the theoretical angle without it. Skip ahead to Part 2 if you must.)
Sometimes it's important to understand what we do not know. As I started working on this piece, my thought was that yes, for the most part, our training should look like what we are training for. If the Open is going to be 30% Olympic lifting, for example, then we should basically spend about 30% of our training energy on Olympic lifting, right? But as I started to think about this, I had a Lee Corso moment: "Not so fast, my friends."
Let's imagine a scenario where there are only two types of movements in the world: running and bench press (the Arnold Pump-and-Run world). If the competition we are training for features 70% bench press and 30% running, how should we split our training to maximize our performance? We will assume all events are scored separately and added together for a total score, so in our preparation, we want to improve our score as much as possible. In other words, we want to maximize this equation:
Improvement in Score = 0.70 * (improvement in bench press) + 0.30 * (improvement in running)
Now, let's assume at first that each hour spent training bench press can improve our bench press an equal amount. And we'll assume that each hour spent training running improves our running by this same amount. Let's now assume that we have exactly 5 hours per week to train, and each hour can score us 10 additional points in the events related to we are training for (keep in mind that the points in the running events are worth only 30% of total points but points in the bench press are worth 70% of total points). If this is the case, what should our training look like? Well, what we have now are two equations that define our improvement in bench press and running as a function of time spent. The way I have defined these, the graphs would look like a straight diagonal line angling up as you move to the right, and the equation for each would be:
Improvement in bench press = 10 * (hours spent bench pressing)
Improvement in running = 10 * (hours spent running)
Rewriting the second equation because we have a finite amount of time to train:
Improvement in running = 10 * (5 - hours spent bench pressing)
Now we can plug our two equations for the improvement into our original equation and try to maximize it. The equation we get is:
Improvement in Score = 0.70 * (10 * (hours spent bench pressing)) + 0.30 * (10 * (5 - hours spent bench pressing)) = (4 * hour spent bench pressing) + 15
I'll spare you the calculus, but the end result is that we would actually want to spend all of our time bench pressing if this were the case. Sure we wouldn't be "well-rounded," but we'd score the most possible points in the competition. Here's a chart illustrating our total improvement each week as a function of time spent bench pressing:

The maximum is all the way at the right side of the chart, meaning devoting all 5 hours to bench press. So clearly, if every moment of training were equal, what we would want to do is focus on the aspect of training that is emphasized more in competition. But in real life, every moment of training is not equal. What we see is diminishing returns, meaning that (in general), the value of each additional moment of training a particular movement declines the more we train that movemen. For instance, if you train your bench press 1 hour per week for 10 weeks, you may be able to bench press 15 more lbs. than you did at the start. But if you increase that to 2 hours per week, you may be able to bench press only 25 more lbs. than you did at the start. At 3 hours per week, you might be at 30 more lbs. Another way to phrase this is that the marginal effectiveness of an additional hour of bench pressing is declining.
In this case, our decision becomes more complicated. Depending on how quickly the marginal effectiveness declines for each movement, the graph of our improvement as a function of time spent bench pressing could look like one of these three curves (or plenty of others):

In these cases, the optimal time spent bench pressing (the pinnacle of each curve) could in fact be 50%, 70% or 80%. In general, the more quickly the returns diminish on each exercise, the closer you'll want to be to an even split between movements. But to my knowledge, we do not yet know what these functions are in reality (and they almost certainly vary depending on the skill level already attained). So even in this incredibly simplified scenario with just two movements, it is impossible to say with any certainty how much time one should spend on each exercise in training.
My feeling is that there are three key things we would need to know in order to determine the "perfect" balance between movements in your training program: 1) the scoring emphasis for each different movement (we do know this to some extent); 2) the amount of improvement to be gained on each movement, as a function of time spent on the movement (this can and probably will vary by movement); 3) the amount of "carryover" from one movement to the others (meaning that training the Olympic lifts might also improve the Powerlifting-style movements, or vice versa). There are some additional considerations with our sport, because you do have to have a minimum level of skill in every area, or else other areas can basically be rendered useless. If someone struggles mightily with toes-to-bar, their performance on 12.3 would be terrible even if they could push press 300 lbs. Still, I believe that, theoretically, we could also optimize these splits, as well as the splits between time domains and relative weight levels in a similar fashion. Potentially, careful research could eventually shed some light onto the second and third items, but at the current time, the best we can do is make educated guesses about them.
So while it seems like we may have learned nothing from this, we have indeed learned something: even if we know exactly what we are training for, we do not yet know the perfect way to train for it. To be sure, understanding what we are training for helps. The more Olympic lifting we are tested on, the more we should train it. But how much more? We (or at least I) just don't know for sure yet.
Part 2: How We Are Training
So we don't know the perfect way to train yet. That doesn't mean that some methods are not preferable to others. Some athletes have made great strides from year to year while others stagnated. There are coaches out there working extremely hard to understand the optimal ways to train, and we can learn from them. I'd like to look at the training for a few well-known CrossFit programs and see how they compare to the Open, which is what the vast majority of serious CrossFit athletes are training for (yes, there are maybe a couple hundred who can safely look past the Open to the regionals, but when guys like Rob Orlando are barely qualifying for regionals these days, overlooking the Open is a dangerous move for most).
Now, I understand that there are other great coaches and great programs out there besides the ones I am examining. Please do not skewer me if I have omitted your favorite. This work is time-consuming, and I do not mean to imply that these are the best programs by any means. They are just a few that I have followed to some extent in the past.
First, let's look at what it is we're training for. This is all based on the analysis from my prior post on what to expect from the Open, but I've grouped the movements into eight categories. A couple notes: 1) "Olympic-style Barbell Lifts" includes things like thrusters, overhead squats and front squats, which either help develop the Olympic lifts or have similar movement patterns and explosiveness (e.g., thruster); 2) "Pure Conditioning" includes running, rowing and double-unders; 3) "Uncommon CrossFit Movements" includes stuff that isn't on the main site often, like sled pushes, monkey bars or the sledgehammer. For a full list of what I've included in each, see the bottom of this post.

Additionally, here are a couple other metrics to help us understand the the load and duration of these workouts. I did not include the time calculations last time. For workouts that are not AMRAP, I have made rough estimates based on the average finisher (all max-effort workouts are in the 5:00 or under category, even if it was a ladder that spanned 8-10 minutes). Please see my last post on what to expect in the Open for more detail on how the others were calculated.

Again, let's mainly focus on the Open. That's what the vast majority of athletes are training for at the moment. Now let's see how these popular training programs compare.
First, some notes on how I handled the tricky parts of this analysis. For the purpose of this analysis, I have assumed that all strength or skill work that is performed in addition to a metcon is worth 0.5 "events." All metcons and all standalone strength workouts are worth 1.0 "events." The goal of this was to weight each part of the training program by how much mental and physical energy they took to complete, and for me, some strength work before a metcon does not tax me the same way the actual metcon does (or a standalone, main site-style strength WOD).
For strength workouts, I basically assumed that a max-effort lift was a 2.0 relative weight. If a percentage of the the max was used, it was multiplied by the 2.0. For strength workouts with a set number of reps, I assumed that doubles were at roughly 95%, triples at 90%, sets of 4 at 85% and sets of 5 at 80%. Beyond that, it was sort of a judgement call. Workouts calling for percent of bodyweight (like Linda) assumed a 185-lb. person.
For strength workouts, I basically assumed that a max-effort lift was a 2.0 relative weight. If a percentage of the the max was used, it was multiplied by the 2.0. For strength workouts with a set number of reps, I assumed that doubles were at roughly 95%, triples at 90%, sets of 4 at 85% and sets of 5 at 80%. Beyond that, it was sort of a judgement call. Workouts calling for percent of bodyweight (like Linda) assumed a 185-lb. person.
Now, for our first program, we will start where it all started: the main site (CrossFit.com). I'm not sure if any top athletes rely primarily on the main site these days, but it's still very popular for plenty of other athletes. I don't even know if Tony Budding or Dave Castro or whoever programs the main site would say that maximizing performance in the Open is even a goal of their programming. Regardless, we'll examine it.
The main site was the first program that I began tracking for this project, and it's also the easiest to track, because of the one workout per day set-up. I have used the past 6 weeks of workouts for this analysis.
The second program is CrossFit New England. I followed CFNE for some time and still sprinkle in workouts from their site in my own training pretty regularly. CFNE is not vastly different from the main site in its set-up, although they do program a decent amount of strength and skill work alongside the metcons. Note that this is not Ben Bergeron's CompetitorsWOD, and so this is probably tailored to a more general audience. I have used the past 3 weeks of workouts for this analysis.
The third program I looked at is The Outlaw Way. I have followed The Outlaw Way a bit, and coach Rudy Nielsen has produced plenty of Games-level athletes in the past few years. In my estimation, this program is the most competitor-focused of the ones we'll look at it today. And it was, without a doubt, the hardest of the programs to analyze. Rudy almost always programs one or two pieces of strength/skill work before the metcon, and so my assumption that these are worth 0.5 "events" is a significant one here. Still, I think we can gain some insight by trying our best to quantify what The Outlaw Way is doing. I have used just over 2 weeks of workouts for this analysis (sorry, but tracking these workouts is time-consuming - there were as many total movements used in 2 weeks as there were in almost 5 weeks of the main site!).
Finally, selfishly, I have thrown in my own training. I began this experiment by tracking my own training, and so since I already have the data ready to go, why not throw it in here, right? For what it's worth, I finished about 200th in my region (Central East) last year and am shooting to qualify for Regionals this year, although I know that's going to be tough. I train 3-on-1-off for about 60-75 minutes at a time. I have used the past 6 weeks of workouts for this analysis.
Let's see how these training programs compare to the Open.


As mentioned above, there is a good deal of judgement involved in compiling this data. Let's not read too much into small differences between programs and try to focus on the big picture. Here are some of my observations:
Going Heavy: All four training programs had a higher LBEL than the Open, and Outlaw was heavier by a wide margin (heavier even than the regionals). The difference seemed to come from the added strength work, because the actual metcons themselves weren't much different than the Open, besides Outlaw again.
Powerlifting: Although we don't actually see many Powerlifting-style movements in competition (back squat, deadlift, press, bench press), we do see it a lot in training. I recall a video where Tony Budding said that max efforts on slow lifts like the deadlift may not be appropriate for competition, but they are useful in training. This seems to be the case - across all competitions, they made up just about 4% of the points, but we're seeing 7-12% of emphasis in these programs.
Couplets and Triplets: We've heard it on the main site before that couplets and triplets (not longer chippers) should make up the bulk of your training, and it seems to be the case for these programs. It is interesting, however, that the main site averages significantly more movements per metcon that CFNE or Outlaw, neither of whom programmed chippers often. Prior work I've done ("Are Certain Events 'Better' Than Other") indicated that chippers were more predictive of overall fitness in competition, so I suppose the theory in training is that each of the movements gets "watered down" too much in a chipper. I'd be curious to know if there is solid evidence to back up this philosophy, although I tend to agree with it. UPDATE: Actually my previous post indicated that workouts with more movements tended to be more predictive of overall fitness, not necessarily that chippers were better than triplets or couplets. In fact, the "best" event through Open and Regionals was 12.3, a triplet.
Surprisingly Similar Balance Across Programs: I was surprised to see that each program generally put the emphasis on the same types of movements. Sure, the main site was a bit lighter on the Olympic lifting and heavier on the basic gymnastics, but in general, things weren't too different. Also note that none of the programs leaned as heavily on the Olympic lifts and basic gymnastics as the Open. Although...
Outlaw Lifts A Lot: One thing that doesn't show up on the comparison above is the total volume of training; it only deals with how the training time is divided. But it's worth pointing out that Outlaw's training goes through many more movements in a typical day than any of the others, and many of them are Olympic lifts. Below is a chart of the at a pure count of how many times the snatch, clean and jerk appeared, regardless of how much it was emphasized within the workout and allowing for multiple appearances in a day.
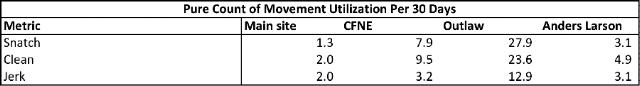
Keep in mind that the metcons at Outlaw are generally pretty short and the reps per set are generally low in the strength work, so the overall volume is not quite as intense as it may appear. And again, this is only two weeks worth of data. Also, CFNE's stats are a little inflated because they post a workout 7 days a week, and it's doubtful that many athletes are following the program completely without any rest.
Note that I didn't try to compute the time domains for the training programs. This is primarily because it was just too hard. I haven't completed all these workouts and I don't have readily available data (aside from combing through all the comments on each site) to figure out the time domains if it's not an AMRAP or a strength workout. But I can say that Outlaw is virtually entirely under the 12:00 domain, and the other three seem to be in relatively the same proportion as the Open.
In my opinion, this analysis is really just a starting point for trying to understand training from a statistical angle. The data points aren't nice and clean, and admittedly there are some pretty critical assumptions involved that can have a big impact on the analysis (I've tried my best to note them along the way). This was not simple and it was not easy.
In no way is programming the only factor in an athlete's success. Diet, technique, intensity and desire are all keys. Still, I believe there is value in continuing to evaluate how we're training and thinking critically about why we're training that way.
Note: I'd be very interested in trying to get some information on the training program for athletes (of all skill levels) who competed in last year's Open and plan to compete this year. We can talk theory all we want and look into some successful programs, but good data would really help to understand what types of training really do bring results. Please email me at anders@alumni.wfu.edu if you have any interest in helping me out. I would not be reporting on any individual's or any gym's training or results in the Open, but simply using information about the training program and improvements from 2012 to 2013. Based on the response, I'll try to gauge whether this is feasible this year.
*Finally, here's a chart showing what movements were included in each subcategory. This is not necessarily an exhaustive list, becaues it only includes movements that appeared in one of the four training programs in my analysis:

*Finally, here's a chart showing what movements were included in each subcategory. This is not necessarily an exhaustive list, becaues it only includes movements that appeared in one of the four training programs in my analysis:


