Now, seeing as don't have a direct line to Dave Castro and Tony Budding, I don't know what they're thinking for next year. But we do have two years and 6 competitions of data that can help inform us about what they're likely to throw at us in a few months. Let's start by looking at the last two years from the simplest, and possibly the most useful, angle: what movements have we seen the past two years, and how often have we seen them. The following chart shows every movement tested in the past two years along with the weight given to each movement. As I've done before, for each workout, I break it down into the movements involved and give each "station" equal weight. For example, on Open WOD 3 last year, box jumps, toes-to-bar and jerk each received a weight of 0.33. On Open WOD 1, burpees received a weight of 1.00 since it was the only movement.
This chart is a great starting point for understanding what HQ is testing when they're testing for the fittest on Earth.
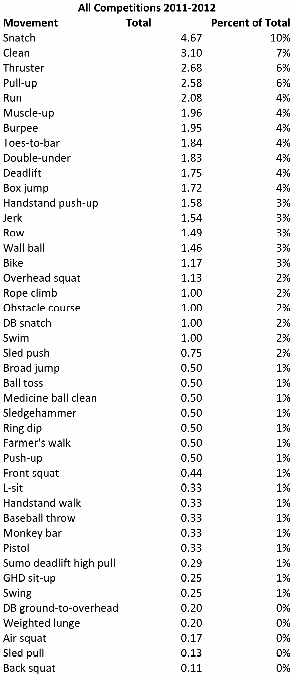
In case you were not aware, you better get your Olympic lifting in order if you want to be competitive in CrossFit. Including the jerk, the Olympic lifts were worth about 20% of all events in the past two years. That's not likely to change. We've seen snatch tested in each the Open, Regionals and Games both of the last two years.
What's also clear is that the pull-up is still important, as are an array of other bodyweight movements, including muscle-ups, burpees and toes-to-bar. Throw in running and double-unders, and we're up over 50% of the total weight (after counting the Olympic lifts). You've got to be good at everything, but those are the basics.
However, these include all competitions. Because of logistic restrictions and the relatively lower skill levels, the Open includes a much narrower list of movements. Here's what we have seen from the Open the past two years.
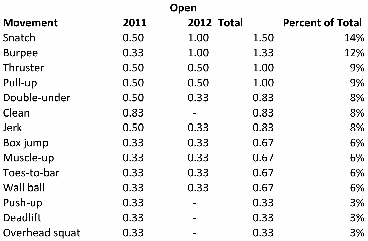
There may a couple of other movements thrown in this year, but not many. I highly doubt we'll see running or swimming, and some other staple movements like rowing, handstand push-ups and rope climbs are not likely for one reason or another (I'm still holding out hope for HSPU's, but I think the odds are slim). Even the swing hasn't shown up in the Open so far.
So the main takeaway here is that for the Open, you basically need to be able to Olympic lift and handle some basic bodyweight movements. You need to be able to do those things very well, but if your handstand walk isn't on point yet, you'll probably be OK.
But we can look deeper. This only tells us what movements we're likely to see. For the lifting movements, there is another aspect we need to consider: the loading.
To understand how "heavy" certain workouts are compared to others, we can't simply look at the loading in a vacuum. The same weight might make for a very heavy thruster but a very easy deadlift. To solve this problem, I started asking around my gym for max lifts on a variety of common lifts. I used the maxes of those at my gym, along with a bit of research into some of the elite athletes and my own personal experience, to develop relativities between the lifts. I'd love to get a bigger sample in the future and refine these numbers, but for now, we'll work with what we have.
Once I got these relativities, I was able to set a "base" weight for each lift. With these base weights, I could then compare the loads we saw in the Open (and the Regionals and Games) and get a feel for how heavy they really are. Along those same lines, we can see what types of weights we could expect, on average, this year. Based on the past two years*, here are the "expected" weights this year.

Keep in mind, those are just the averages. We've seen relatively heavier and lighter loads than those in the past. Based on the heaviest workout we've seen (the squat clean and jerk from 2011) to date, we can make an educated guess about the heaviest weights we might see this year. Adding on a 5% margin in case Castro gets crazy, here are the heaviest weights you can reasonably expect to see required in a workout (rounded to nearest 5).
Clean: 180 (men), 120 (women)
Jerk: 175, 115
Snatch: 135, 90
Deadlift: 320, 215
Thruster: 145, 95
Overhead squat: 155, 100
Back squat: 255, 170
Front squat: 215, 140
Now, I know we're mainly focused on the Open, but let's give these numbers a little perspective by looking at the Regionals and the Games as well. I've calculated the average relative weight seen at each competition for the past two years. Things got a bit tricky at the Games with movements like the sled push, so there were some judgement calls**. Nonetheless, this gives us an idea of the relationship between the various levels of competition.
A 1.0 is equal to the "base" weights in the charts above (135-lb. clean, 100-lb. snatch, etc.). These charts include metcons only (I'll discuss the max effort lifts in a bit, but of course there have not been any in the Open).
UPDATE 12/10/12 - This graph originally had incorrect values for the Open (they were too low). The error was only in this graph, not in the underlying numbers mentioned elsewhere.

As you can see, the loading gets substantially heavier once you get beyond the regionals. This makes sense intuitively to anyone who's followed the Games season the past two years. The average weights you could expect to see in a men's metcon at the regionals include a 155-lb. clean, a 275-lb. deadlift and a 185-lb. front squat. Those are just the averages - we've seen much heavier.
Finally, let's combine the two concepts of loading and movements. What I was curious about understanding was just how much emphasis was placed on lifting, and lifting heavy, in each competition for the past two years. Consider the 2011 and 2012 regionals: based on the average weight load in metcons, the competitions were roughly equal in terms of load. However, as I thought about it, it seemed intuitive that the 2012 regional was much "heavier." After all, we saw 225-lb. cleans, 345-lb. deadlifts and 100-lb. DB snatches. Additionally, we had a max-effort snatch. The 2011 regional was heavy (315-lb. deadlifts, 135-lb. snatches, max thruster), but it didn't seem as heavy.
The reason? The 2012 regional had more lifting, although not necessarily heavier lifting. And that's what really matters if we're trying to judge these things. When Chris Spealler, a little guy, says the regional programming was really tough for him this year, what he means is that there were a lot of lifts and they were awfully heavy.
The following chart shows the ratio of bodyweight movements to lifts in each of the last six competitions.
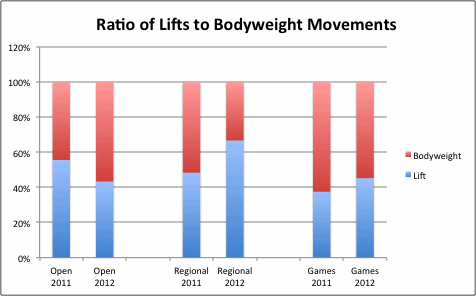
We can see that the 2012 Regional has had the biggest lifting bias, by a decent margin, of any competition in the past two years. Using this information and the average loading we developed earlier, we can get a total picture of how much heavy lifting was emphasized at each competition. The following metric, which I've called Load-Based Emphasis on Lifting (LBEL), is calculated by taking the average weight load (including max effort lifts***) and multiplying that by the percent of the movements that are lifts. The numbers here are harder to interpret, but this may help: "Fran" for men is about 0.45, "Grace" is 1.0 and "Cindy" is 0.0. Do all three of those for a competition, and you'd get about 0.5 for the competition as a whole.
Here are the LBEL scores for the past two years.

You can see that the 2012 Regionals was by far the top score. You may also notice that the Games are often equal to or lower than the Open. This is because the Games often focuses heavily on bodyweight movements not seen at earlier levels (long runs, obstacle course, deficit HSPU, handstand walks, etc.). The Games is not "easier" than the Open by any stretch. The loads you do see at the Games would be too much for 95% of the athletes who compete in the Open, and the strength demands of the bodyweight movements are extreme. But if you want to know which programming more favors a bigger, stronger athlete over a smaller, better conditioned athlete, I think they are actually pretty similar.
The main takeaways here are these: 1) For the Open, the emphasis is on Olympic lifting and some basic bodyweight movements; 2) The loadings at the Open are moderate, but lifting is emphasized quite a bit; 3) Things are likely to get heavy at the regionals; 4) The Games has more emphasis on bodyweight movements, but be prepared to lift heavy when you do lift; 5) It's time to get back to training - only 5 months left until the 2013 season begins!
Math notes:
*For the snatch workout this year, the weights varied based on how far you got in the workout. I looked at the top 1,500 overall finishers (roughly the regional qualifiers), and calculated an "average" load throughout the workout. The reason for using the top 1,500 is that I wanted this post to be from the perspective of someone attempting to qualify this year. The average weight came out to be 128 lbs. for men and 76 lbs. for women. In calculating the average, I looked at the total amount of weight lifted, then looked at how much of that weight was lifted at each level. For instance, if you got a score of 60, that's 30x75 = 2,250 lbs. lifted at 75 lbs. and 30x135 = 4,050 lbs. lifted at 135 lbs. Therefore, 64% was lifted at 135 and 36% was lifted at 75. The average would be .64x135 + .36x75 = 113.6 lbs.
**Here are the relative weights I assigned to the lifts not listed on the original "base" weight chart (these are the men's weights, women's were generally reduced to about 2/3 of these):
Swings (53 lbs) .75, DB ground-to-overhead (45 lb DBs) 1.00, weighted lunge (45 lbs) 1.00, DB snatch (100 lbs) 1.50, farmer's walk (100 lb. DBs) 1.50, weighted pull-up 1.08, water jug carry 1.50, dog sled 2.00, sumo deadlift high pull (108 lbs) 1.14, sled pull with rope 2.00, ball toss (4 lbs) 0.50, medicine ball clean (150 lbs) 1.5, blocking sled push 1.50, sledgehammer 0.75.
If you'd like more info on how I arrived at these, let me know and I'll expand on my thought process.
**For the max effort lifts, I took the average result for each competitor. Max effort lifts are tricky because they are dependent on who is doing the workout (similar to the Open snatch WOD). In general, I'd expect most max effort lifts to be about twice the average weight load seen at the competition. That would mean the metcons are generally done at about 50% of each person's max, which is pretty typical if loads are scaled properly.