For the first couple of months after the Games, I kept thinking that I needed to get started on my Games recap and hopefully a few new analyses for the offseason. I'd do it tomorrow, I thought, just after work and life slow down. When would that happen? Tomorrow turned into next week, next week turned into next month. Sometime in November, I realized the slowdown wasn't coming any time soon.
I've been adding more and more to this site for the past three years, culminating with the 2nd annual Games Pick 'Em contest this year, which went as well as I could have hoped. We had nearly 75 entries and I was able to keep the standings up to date throughout the up-and-down Games weekend. But since that time, work has picked up and shows no signs of slowing. On top of that, my wife and I are expecting our second child in April 2016. There's just no way I can realistically keep the bar high for content on this site with my current schedule. And if it's going to turn into a half-assed effort, I don't think it's worth it. I'm proud of the level of quality and timeliness that I reached with the site in 2015, and I don't want to sacrifice that.
I don't know if the site is done forever. I hope not, but I also realize it will be hard to get resurrect things after a long time off. My goal is to keep somewhat up to date with aggregating data, which has always been the toughest part of this operation. The web site itself will remain up, so hopefully those of you that are relatively new can still peruse old posts, many of which are still relevant today, in my opinion.
I'd like to thank everyone who has read, commented or contributed to this site over the past three years. Almost all the feedback I received here was positive, or at least constructive. I've only met a handful of you in person, but I feel like I had a small little community of folks that I "knew," albeit only through internet comments, podcast and tweets. So if and when the day comes to get this thing started again, I hope you'll all be here to start reading again.
As always, good luck with your training!
Tuesday, December 1, 2015
Wednesday, September 9, 2015
Back from the Dead with More 2015 Games Analysis
In late July, I caught a break at work that allowed me to watch the 2015 CrossFit Games nearly uninterrupted from Friday through Sunday. I kept up with the CFG Analysis Games Pick 'Em daily and took to Twitter several times a day to converse with others about the action. It was glorious.


The day after the Games ended, things turned around in a hurry. Free time evaporated quickly, replaced by weekends and nights working just trying to keep up at work. In past years, I typically like to post my thorough CrossFit Games recap within a few weeks of the end of the Games, but that just hasn't been possible this year. But I have been able to chip away at a few different analyses, and I figure now is as good a time as any to post what I've found. I know many of you have moved onto the Team Series (starting today!), but this post will focus on the individual 2015 Games season.
Katrin Tanja Davidsdottir and Ben Smith Deserved It
As I do most years, I looked at the results from this year's Games under a number of different scoring systems, and Davidsdottir and Smith wound up on top in all of them. Here are the top 3 under the various systems I tested:
- Classic Points-per-Place (low score wins)
- Men - Smith, Fraser, Gudmundsson
- Women - Davidsdottir, Toomey, Sigmundsdottir
- 2012-2014 Games Scoring
- Men - Smith, Fraser, Gudmundsson
- Women - Davidsdottir, Sigmundsdottir, Briggs
- Normal Distribution Points-per-Place
- Men - Smith, Fraser, Gudmundsson
- Women - Davidsdottir, Briggs, Sigmundsdottir
- Standard Distribution System (not points-per-place)
- Men - Smith, Fraser, Gudmundsson
- Women - Davidsdottir, Briggs, Toomey
Metcons at the Games Keep Getting Heavier
Since the Open began in 2011, the required weights at the Open and Regionals really haven't changed significantly. Think about it: how many times have we seen 75-lb. snatches required for men in the Open? (answer: 4) But at the Games, we've seen a steady trend of heavier and heavier metcons over the years. In 2011, it would have been unreasonable to have 100-lb. dumbbell snatches required in a metcon. Even something like Heavy D.T. (205/145) would have been a major stretch.
The chart below shows the average relative weight load at the Open, Regionals and Games since 2007.

The chart above does consider the 2014 Clean Speed Ladder and the 2015 Snatch Speed Ladder to be metcons, which I think is reasonable considering the weights are required and the athletes are expected to move the weights quickly. If we exclude them, the pattern is generally the same, but it flattens out in 2013-2015. Note that the levels are still well above pre-2013 levels.

2012 Regionals Still the "Heaviest" HQ Individual Competition Ever
Despite these increases in loading for metcons, the 2015 Games was still only the third "heaviest" competition in history, according to load-based emphasis on lifting (LBEL). That's because the points for the 2015 Games were only 49% from lifting events, which is only slightly above the historical average. This year's Games had an LBEL of 0.80, which is above the historical Games average of 0.67 but not an all-time high. The 2014 Games were 55% lifting and therefore had a somewhat higher LBEL (0.89). This is the highest all-time for the Games, but not among all HQ competitions.
The 2012 Regionals remain the gold standard as far as lifting-biased competitions. The points at that competition were 67% from lifting events and the average load in metcons was 1.15, which is on par with the 2011 and 2012 Games and higher than the 2013 and 2015 Regionals. The LBEL at that competition was a staggering 0.92, more than 34% higher than the historical Regional average (0.69). It's still a minor miracle that Spealler was able to pull out a qualification spot.
Want to Win the Games? Better Be Able to Run.
Despite having minimal emphasis at the Open and Regional level, we see yet again that running is a huge component at the CrossFit Games. Running made up 16% of the total points this year, marking the third straight year with at least 11% of the points. In every year since 2012, running has been one of the top 3 most valuable movements at the Games.
In contrast to what we saw at Regionals, where Olympic-Style Barbell Lifts and High Skill Gymnastics made up a ridiculous 81% of the points, they made up less than 40% of the total points at the Games. Aside from running, we saw 30% of the points come from Uncommon CrossFit Movements, including swimming, paddle board, sandbag carry, pig flip, yoke carry, assault bike and peg board climb.
Wednesday, August 5, 2015
Podcast Episode 13: Games Recap with Jesse Mager
Today Anders chats with Jesse Mager, aka JesseM, the second-place finisher in this year's Games Pick 'Em and the champion of last year's Games Pick 'Em. Anders and Jesse chat about how he was able to be so successful in the Pick 'Em, as well as thoughts on the Games in general, whether the pegboard was too hard, if Murph was unsafe and the age at which people should stop doing muscle-ups and squat snatches (maybe never?).
Thursday, July 30, 2015
Initial Games Thoughts
I needed a couple days to decompress from binge-watching this year's Games, but I've been able to do some preliminary analysis and put a few thoughts together. I'll follow up in the next week or two with some more in-depth coverage of this year's Games and the season as a whole.
- Let me start by saying I thoroughly enjoyed watching this year's Games. This is the first year since 2011 that I haven't made the trip to Carson, and while it would have been fun to be there in person again, I thought the live coverage was great overall. Yes, there were some hiccups for us swapping between ESPN3 and the TV feed, causing us to miss out on some early heats that weren't shown on TV, but overall I had no trouble watching as much as I wanted. The announcing has improved leaps and bounds since 2011, and thankfully they treat it as a real sport rather than an excuse to try to sell people on CrossFit (for the most part). That said, I could have done without the constant hyping of the "Assault" bike that's just a fancy version of the AirDyne that's been around since I was born.
- The final event, particularly for the men, was without a doubt the most thrilling in Games history. I'll hold my comments on the pegboard climb for later, but the sheer fact that both champions were NOT in first place heading into the final event made for some top notch drama. After Pedal to the Metal 1, I had a buddy text me asking to do a post comparing Froning in his prime to present-day Mat Fraser (assuming Fraser would proceed with another event win and hang on), but within minutes, Fraser had fallen into second place. And the women's final was just as exciting (excluding the pegboard, I know), with Davidsdottir going unbroken on the deadlifts and farmer's walks LIKE A BOSS. It was really tremendous.
- On the whole, I thought the programming made for some fun events to watch. I'll get into the safety concerns momentarily, but personally, as someone not doing the events, these were really solid for the viewers. The Soccer Chipper was one of my favorites, and I also thought the Midline Madness (not a great name, in my opinion) was particularly intriguing. And then Pedal to the Metal 2 was also pretty great, although those deadlifts looked awfully sketchy (maybe that's just the way I think after a couple back injuries).
- Ben Smith would have won easily using the classic one-point-per-place scoring system (86.5-to-109.5 assuming the points were cut in half for the two sprint events). Not saying I like that system better (I don't), but it does lend more credibility to Smith's victory. He deserved it. The women's top 3 also would not have changed.
- OK, now for the pegboard. Everyone has a different opinion here, but my opinion is that at least one element of this should have been changed. You just cannot have one of the two final events, on national TV, where the majority of the athletes in the final heat (including the eventual champion) cannot complete a single rep. That just can't happen. Either: a) have this event earlier in the competition when people were fresher and it wasn't in prime time; b) allow athletes to drop from the top to make it easier to complete a rep; c) put the pegboard at the END of the workout; or d) announce it ahead of time so athletes could practice. I mean, any of those would have been preferable to what took place on the women's side, right?
- There have been many people who have criticized the programming of this year's Games for being too dangerous for the athletes (here's a great one). I've been around this sport long enough to know that no matter what, there will be criticism of the programming. It does not matter what comes out, there will be pissed-off people. So I'm cautious to overreact here. But we should at least take notice when you have former champions like Annie Thorisdottir dropping out due to exhaustion.
- I wasn't in Carson, and I certainly wasn't competing, so I can't really speak to how the events felt. But, I can say that looking at the programming as an outsider, I think there wasn't anything exceptional about this year. By my estimates, the total time competing was around 163 minutes, which is less than 2012 and 2012 (both above 200) but more than last year (about 130). Things were pretty heavy but not outrageous by Games standards (0.80 LBEL, lower than last year but above the Open-era average of 0.67). This is fourth year of the past five that there has been a long event early on Friday. And the weather, at least compared to where I've always lived, was not terrible (high was 85 Friday according to AccuWeather). I think the big key was simply the Murph event:
- This event was a much higher-rep workout than the long events of the past, meaning more likelihood for things like Rhabdo.
- They held the event in the heat of the day, rather than the morning like in the past. Things are so much more reasonable earlier on, when the Triple-3 was held last year.
- The weight vest added an extra layer of heat, and obviously, athletes aren't allowed to strip that layer off.
- Despite the fact that I'm generally not being too critical of the programming, I wish that at least once in my lifetime, CrossFit HQ will show just a touch of humility and compassion, and perhaps consider admitting when they might be wrong (GASP!). When you see stuff like this Facebook post from Russell Berger, it just makes any level-headed person want to puke. Insulting your own athletes? Really? Do we need to just hand the CrossFit enemies more ammunition?
- The final thing I'll say, and I've said it for years, is that if we want the Games to be a slug-fest with ultra-long events, then we need to send the athletes who are most capable of doing well. I'm not surprised that many Games athletes struggled with Murph, considering they don't need to perform well on that type of event to make it to the Games. Sure, there is a relatively long chipper at the Regionals every year, but nothing like a 45-minute swim/paddle or a 600-rep workout in the heat of the day. Yes, some of these athletes can handle those events quite well, but many cannot. So either don't test those elements at the Games, or test them earlier on in the qualifying process.
Well I've already gotten pretty long here, so that will be it for now. Don't worry, more to come in the coming weeks. Stay tuned.
P.S. I did read the whole interview with Emily Abbott that has been so often quoted (a cached version is here), and honestly it's not nearly as bad as some of the quotes that have been cherry-picked out of it. Take a read and let me know what you think. I am disappointed it was taken down from the site, though.
Thursday, July 23, 2015
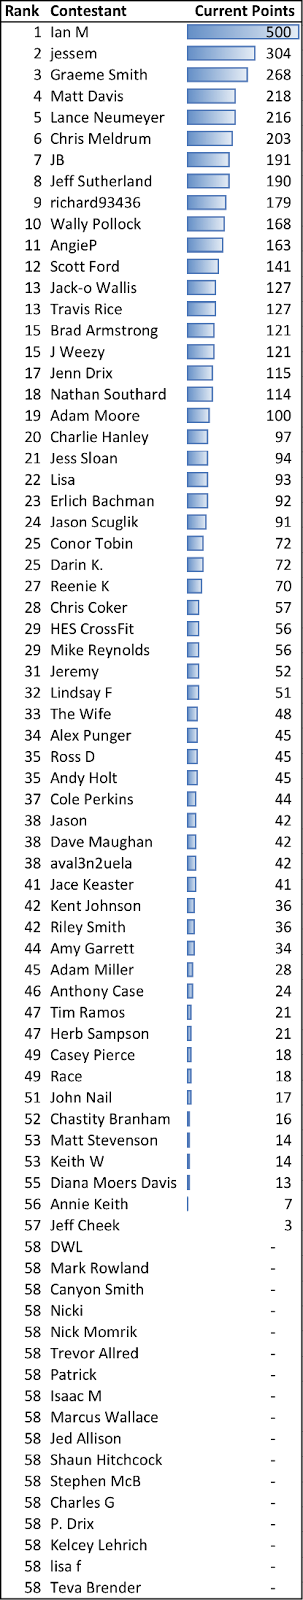
Current Pick 'Em Standings (FINAL)
Standings below are final, pending any potential mistakes I made. PLEASE LET ME KNOW ASAP IF YOU FEEL THERE IS AN ERROR WITH YOUR POINT TOTALS.
This was a wild CrossFit Games, and in the end, the bookie (me) wound up making a huge profit on the gamblers (all of you). The field racked up a mere 5,231 points on 7,400 points of wagers. Not a single one of the 74 entries had Katrin Tanja Davidsdottir winning OR Tia-Clair Toomey on the podium. And I'll be the first to admit, I didn't see this coming either. Better luck next year, and congrats to Ian M!
This was a wild CrossFit Games, and in the end, the bookie (me) wound up making a huge profit on the gamblers (all of you). The field racked up a mere 5,231 points on 7,400 points of wagers. Not a single one of the 74 entries had Katrin Tanja Davidsdottir winning OR Tia-Clair Toomey on the podium. And I'll be the first to admit, I didn't see this coming either. Better luck next year, and congrats to Ian M!
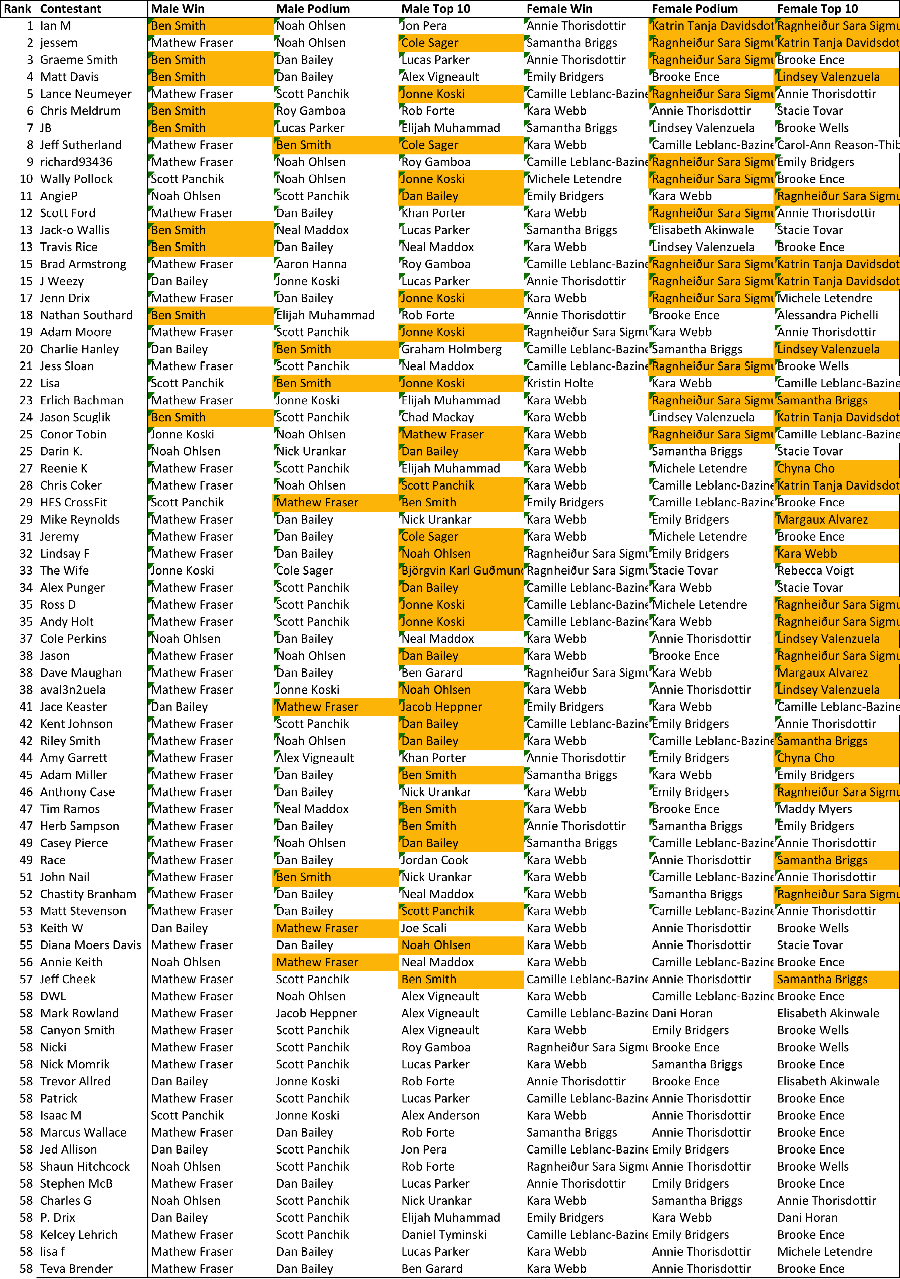
Individual picks are below, with orange highlights for all correct picks.
Monday, July 20, 2015
Podcast Episode 12: Games Preview
Today old friend and long-time CrossFitter Alex Punger joins the podcast to chat about the upcoming CrossFit Games. The two discuss the programming so far, which events they'd like to see repeated from the past, whether or not the softball toss should come back (hint: no) and their picks for the Games Pick 'Em.
Monday, July 13, 2015
Reliving the Best Individual Event Performances in Games History
Today, with just over a week remaining until the 2015 CrossFit Games kick off, I've decided to look back at some of the most impressive individual event performances in recent Games history. How to determine the "best" performances? By using the standard deviation scoring method that I proposed way back when (not that I'm the only one to have proposed it). Using this method, we compare each athlete's score to the average score in that event, then divide by the standard deviation of scores in the event. The larger the number, the further above average the athlete was. This allows us to compare performances across events, and in this case, identify the truly standout efforts.
I'll keep the commentary short here, and instead, point you to videos that you can watch discreetly at work (or in the comfort of your own home, I suppose). For now, I've limited my analysis to 2012-2014. I'll try to expand back into the dark ages at some point. Enjoy:
2013 Legless (women) - Winner: Alessandra Pichelli (4.36 standard deviations above average)
2014 Sprint Sled 1 (men) - Winner: Neal Maddox (3.43 standard deviations above average) - Note: Neal is in the 2nd heat
2014 Cinco 2 (men) - Winner: Rich Froning (3.31 standard deviations above average)
2014 Sprint Carry (men) - Winner: Nate Schrader (3.13 standard deviations above average) - Note: Nate is in the 1st men's heat
2013 Cinco 2 (women) - Winner: Talayna Fortunato (2.89 standard deviations above average)
2012 Rope-Sled (men) - Winner: Matt Chan (2.80 standard deviations above average)
And just for good measure, two of my favorites for the fantastic finishes. Both involve Josh Bridges. I do think the Games will miss him this year.
2014 Push-Pull (probably my vote for the most exciting Games heat of all time)
2011 Killer Kage (note: Bridges actually didn't even win this event, that was Spencer Hendel in a prior heat. But still...)
Subscribe to:
Posts (Atom)